($MKTX) MarketAxess: Quick thoughts on HK's croupiers, sea change, and MarketAxess
Some random commentary on a beaten down, asset-light, "sea change" beneficiary
(Disclaimer: I started drafting this post when MKTX stock was around $230-$220/sh in early December, which is the approximate cost basis for the bulk of my position. I’ve bought a bit more during the recent run-up, but only in nibble-sized amounts and have slowed buying significantly. I’m not totally convinced we won’t revisit my cost basis again at some point in the next year and I’ll probably throw in another 1-2% of the portfolio if that happens —depending on the reason for the re-visitation.)
**********UPDATE 20240131: Well, well, well… sucks being right on that disclaimer prediction.
(And in just one day, as well; ouch.)
**********
MKTX
TLDR:
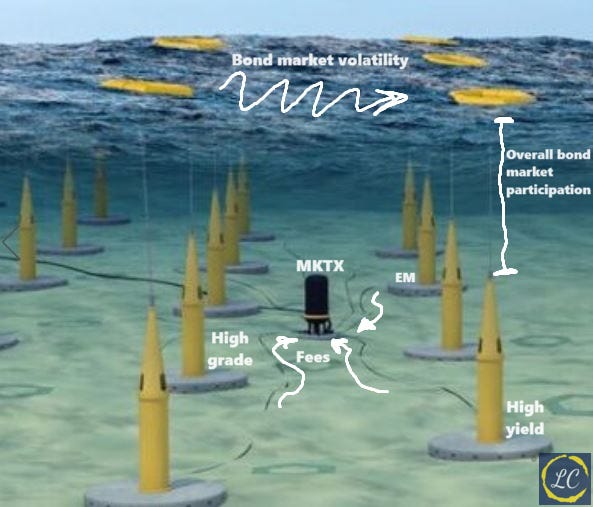
(Base image borrowed from: https://www.hydroreview.com/world-regions/europe/seabased-wave-energy-technology-to-be-installed-in-canary-islands/)
.
MarketAxess1 (MKTX) is the dominant trading venue for US corporate and emerging market bonds and is trading below its COVID lows; the new CEO recently buying shares around current levels (note that I started drafting this post in early December, before the recent market run-up). The company is asset-light, has no debt (as well as a net buyer of its own stock), and has consistently returned capital to shareholders without a single year of negative FCF/sh since 2003. There have been investor concerns around market share growth in the face of new competition for corporate bond trading and the stock has taken a beating since 2021, but I’m thinking that a lot of that pessimism has been priced into the stock and management seems to be taking the growth issue a bit more seriously now. Meanwhile higher-for-longer interest rates and their implications for the credit markets are being discounted.
If Howard Marks is correct in his “sea change” predictions for the fixed income asset class as the contractual pre-tax yields there begin to approach longterm equity return expectations and gets asset allocators asking themselves “What are the arguments for not putting a significant portion of our capital into credit today?”, then MKTX’s dominant position in US investment/high grade (HG) and high-yield (HY) corporate bond trading volumes2 would be a major beneficiary of a structural shift in fund flows that would raise all ships. We may indeed now be approaching the case where “credit instruments should probably represent a substantial portion of portfolios… perhaps the majority”.
(On a related note, for any just-buy-a-mutual-fund/etf people3, T. Rowe Price recently launched a new MF this year that will invest 50-70% of net assets in fixed-income and other debt instruments, 30-50% in common and preferred stocks, and is being run by management with an excellent track record vs peers. I think it’s pretty interesting and perhaps this is the better sleep-well-at-night way to benefit from higher rates4. You can read more on that here: https://www.mutualfundobserver.com/2023/12/launch-alert-t-rowe-price-capital-appreciation-income-fund/)
In any case, whatever future our timeline converges on, I think that a non-zero allocation to MKTX (and certain other higher-for-longer- and rate-volatility-beneficiaries)5 is a good contingency investment to diversify for this potential sea-change shift (that also has some additional interesting counter-cyclical or buffering characteristics vs the S&P 500 as well). That is, when thinking about the expectation value…
…of the call option that MKTX has on higher-for-longer rates and subsequent fund flows, I think the market is greatly discounting the magnitude of p(xi) in this case; this call option being wrapped up in a beaten down bond market croupier.
Croupiers and exchanges
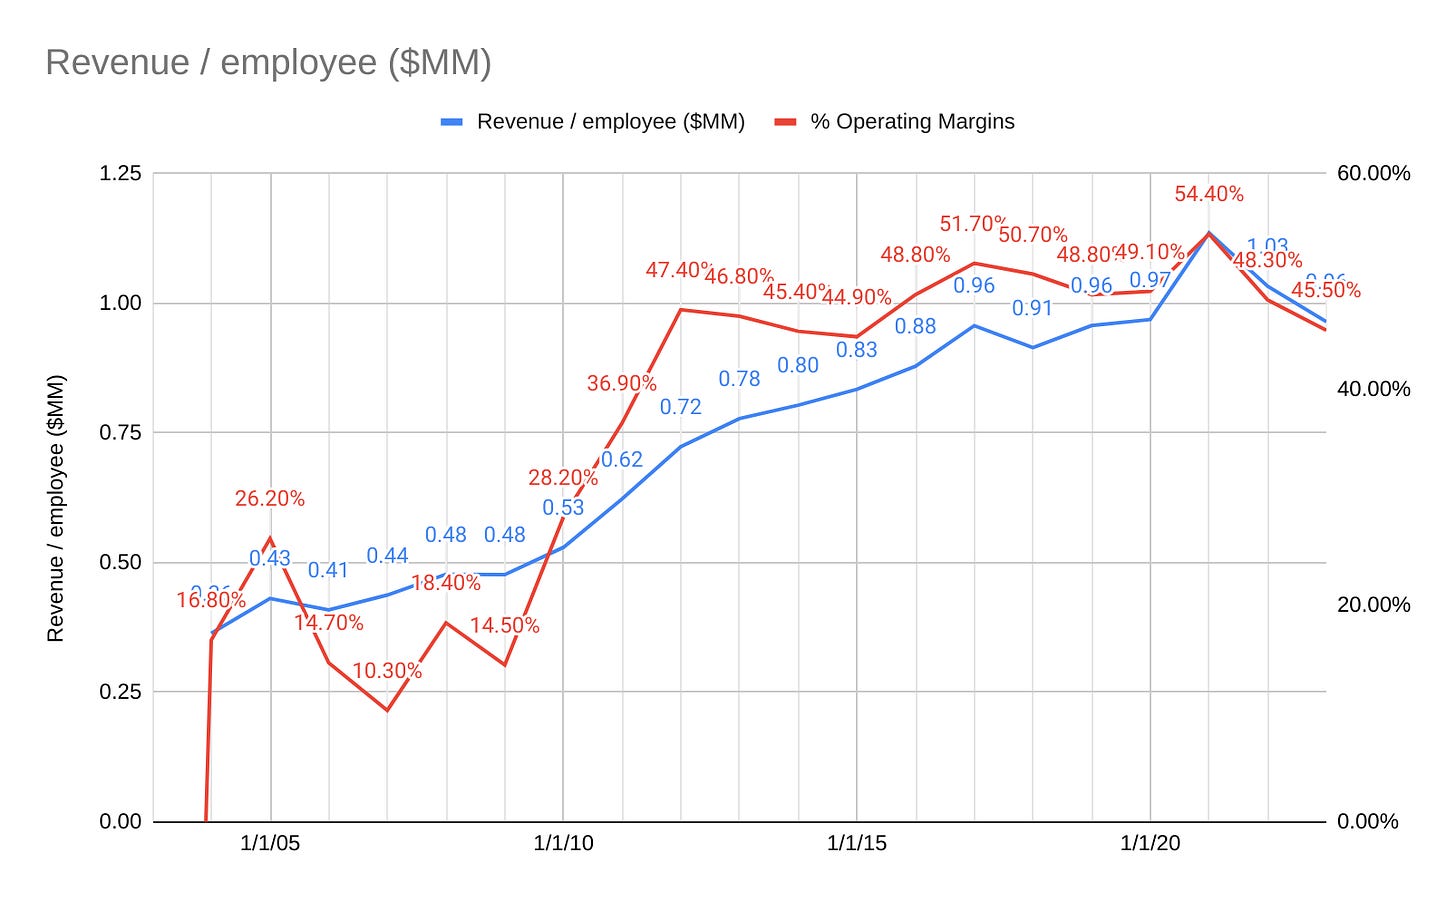
Exchanges are asset light businesses with most of their expenses being related to maintaining and improving their electronic trading systems as well as complying with regulatory financial oversight and reporting. MKTX’s margins have remained quite high over the last 20 years —remaining relatively high during the 2008 GFC and appearing unaffected by (and, in fact, slightly benefiting from) the 2020 COVID volatility.
(Note on the first figure: While there was a large increase in “professional and consulting fees” in the 2005 10K related to MKTX’s November 2004 IPO and subsequent costs of being a public company from that point on, the noticeable dips in gross margins in the graph really seem to be related to the fact that in the years 2005, 2007, 2008, and 2009 TIKR.com includes employee comp expenses in the COGS line rather than the opex lines of the income statement data (IDK why). Without these data anomalies, you would see MKTX revenues and operating income generally showing constant growth through the period. So, just imagine a straight line around the 90% mark for gross margins in the image above.)
Exchanges tend to be durable businesses due to their powerful network effects as trading activity tends to pool around the more liquid trading venues which works in a virtuous cycle (amplified by continual technology investments that are usually only a small fraction of an exchanges cashflows) to create even more liquidity and attract even more trading activity (not only from existing traders that may have been trading on other venues, but from new clients that may now find the market liquid enough for them to trade in where they may have otherwise been unwilling or unable to by mandate). Even the release of similar products across competing exchanges has a non-zero-sum quality in that it can create arbitrage opportunities that draw traders to transacting on both exchanges in order to capture that spread.
“The availability of data is a precursor for many market makers and investors to enter a market, especially those whose business is driven by quantitative models. And as those firms have entered the market, the increased trading activity they have brought with them has generated more pricing signals, which, in turn, attracts more market participants. This virtuous cycle that was set in motion a decade ago shows signs of continuing to accelerate in the years ahead.” —- https://www.sifma.org/resources/research/understanding-fixed-income-markets-in-2023/
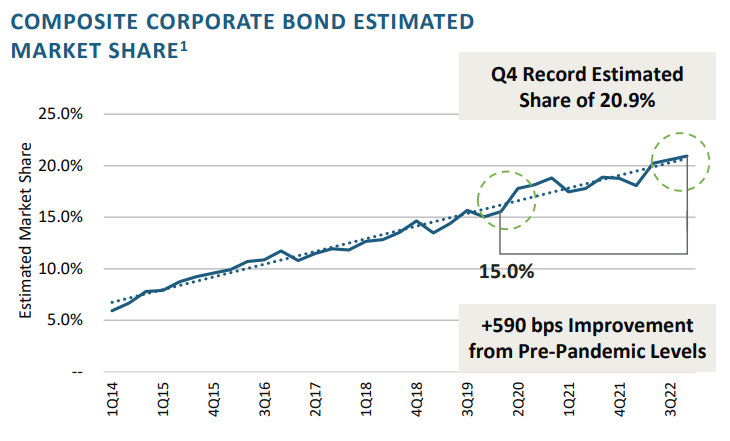
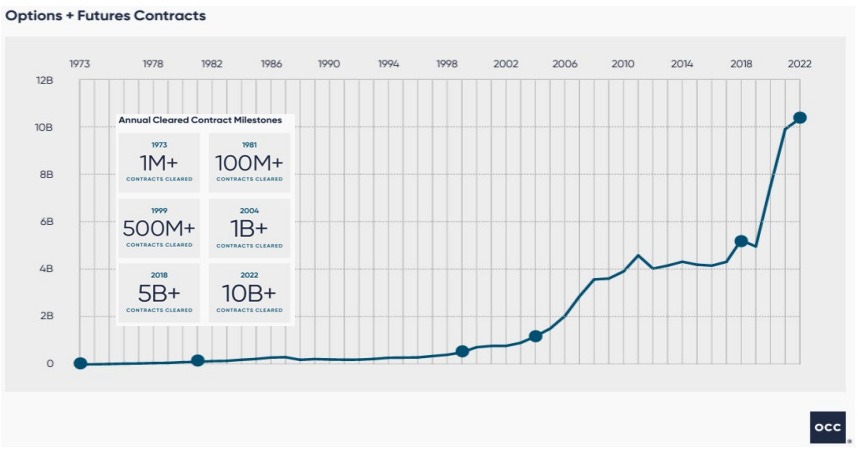
(https://www.mysanantonio.com/business/fool/article/Record-Trading-Volume-Fuels-MarketAxess-Holdings-6788103.php; https://s201.q4cdn.com/767283836/files/doc_financials/2022/q4/4Q_FY-2022-Earnings-Deck-FINAL.pdf)
In the latest Horizon Kinetics Q3 commentary, a good deal of time is spent covering the benefits of securities exchanges and the croupier-like6 characteristics of these businesses. Both exchanges and casinos provide a centralized marketplace that matches together parties wishing to place opposing bets on uncertain outcomes (movement of prices for exchanges, games of chance for casinos); they enable trades and transactions without directly partaking in risk.
The commentary mainly focuses on exchanges’ exposure to the large options and derivatives market which has seen rapid growth over the last 20yrs and the subsequent diversifying quality that these exchanges have wherein their economics are tied to the trading volumes of a broad range of financial products on their platforms and these trading volumes are themselves tied to the overall popularity of —or interest in— those varied products and underlying asset classes (regardless as to whether the values of the underlying assets are currently being priced upwards or downwards by the market).
Thus, the revenue mix of exchanges is diversified in a manner proportional to the growth and innovation of asset classes (that trade on that exchange in some form) across global capital markets. From contracts for equities and bonds to commodities, foreign currencies, and crypto, these assets all come to be traded on these centralized exchanges as they gain threshold levels of popularity and generate trading volumes and fees in corresponding amounts. This is as opposed to modern market index funds whose returns have come to be dominated by the fortunes of a narrow band of large equities7 (whose underlying economics themselves happen to be rather closely related and, for the most part, more capital intensive than electronic exchanges).
Again, you can read the whole commentary here; I think it’s pretty interesting.8
A question I had…
In 2022, Charlie Munger gave an interview at the Singleton Prize for CEO Excellence presentation where, among other things, he commented on the casino-like nature of the current stock market:
“It's crazy what we ended up with. It's absolutely crazy. And civilization would have been a lot better without it. Now, we do get a certain amount of craziness in real estate, which doesn't have a liquid market. It isn't like, you wouldn't have a lot of excesses or speculation, even if the stock market were illiquid, as real estate, but it wouldn't be as bad as it is now. Now it's gone berserk. When I was in Harvard Law School, it was a rare day when they'd pay for a million shares a day. Maybe it would happen once or twice a year. Now they trade billions of shares every day. And the computers are trading with one another. One computer algorithm is trying to outwit the other. Now, what earthly good is it for our country to make the casino part of Capitalism more and more efficient, and more and more attractive, and more and more seductive? It's an insane public policy. On the other hand, I think the chances of changing it are practically zero. And yet it causes terrible things. You could argue that it caused the Great Depression.” —- https://www.linkedin.com/posts/mohnish-pabrai_singleton-prize-for-ceo-excellence-charlie-activity-7046769324593745921-rodq/
… well perhaps that change is actually upon us (or perhaps this is just a good endorsement of the durability of exchanges’ croupier business models).
While HK mainly frames the derivatives market from the value-additive POV, around their facilitation of genuine business hedging (eg. value-creating transactions where productive businesses that have exposure to the real underlying commodity are able to transfer a portion of risk and cashflow volatility to another risk-taking party), they seem to ignore the significance of speculator-to-speculator activity in the derivatives market (eg. zero-sum transactions of traders speculating on commodity futures contracts between each other without having any actual positions or risk exposures in the underlying physical markets and rather just betting on price direction to profit on price movements rather than the transfer of risk related to any of their own commercial activities). That is, HK’s commentary here appears to be ignoring the portion of activities of the business that are more closely related to the casino origins of the “croupier” concept that they like to reference so much.
My main question when reading the commentary was: If HK believes that the past 40yrs of equity returns and monetary policy have been an aberration (as they’ve written so much about in the past)9, might there not be a good risk of much of the past two decades of derivatives activity largely being driven by 1] pure speculation (or at least to a degree that would greatly affect securities exchanges if that trading activity were to significantly diminish) and 2] a corresponding structural decline in interest rates that have pushed more investors into greater-risk assets and activities to achieve returns that used to be available in safer assets further up the capital structure (while also making the cost of leverage for trading ever cheaper)?
(https://horizonkinetics.com/app/uploads/Q3-Commentary-FINAL.pdf; Notice that for all but the 30yr UST futures, volumes explode around the early 2000s, when the dot-com bubble burst and the Fed cut interest rates nearly 80%, from 6.5pps to 1.5pps)
I suppose one less concerning explanation for this relatively recent explosive growth in the derivatives market could be attributed to the development of computer technology, algorithms, and the internet around that same time, enabling the globalization of capital markets and greater access to financial instruments for unbundling legitimate business risk. This answer may be good enough. In that case, MarketAxess is not really a better or worse exchange business than the equities/derivatives-focused venues in the grand scheme of things —and a basket of exchanges dealing in all manner of equity, UST, and commodity derivatives, as HK holds, would be fine.
(I’ll note that when I was initially looking into this, I cynically assumed that speculation would be a very large —and obvious— element of the derivatives market, but keeping an open mind as I looked into it more, the answer does not seem so cut-and-dry and I really couldn’t find any smoking gun on this idea one way or another. Even when looking at derivatives that are not settled by physical delivery, IDK that it would be right to just say that all commodity contracts that don’t physically settle are categorically speculative because, for example, Party A may be gaining insurance on their commodity prices while Party B gains current income on that transfer of risk; types of contracts that can seem to be zero-sum, might not be, depending on how parties are using them. Maybe there’s more definitive information I’m missing here.)10 11
Continuing to take a more cautious view, we could put the concern like this: How might higher-for-longer rates negatively affect the overall trading activity across a broad basket of exchange businesses? (My understanding of HK’s own overall economic outlook being that they believe we are going to see an era of higher-for-longer in both interest rates and inflation).
For example, zero-bound interest rates through this last decade historically pushed more investors further out along the risk curve by shifting the efficient frontier for all market participants, encouraging them to take on greater risk in search of sufficient yields12 (pension funds and endowments typically need returns of something like 5-8% per year)13, and created cheap leverage with which speculators could trade all manner of derivatives.
(https://content.naic.org/cipr-topics/low-interest-rates; “Life insurers keep comparatively large balance sheets, and a substantial share of their assets (over 60% in the aggregate) are interest-earning bonds. With lower interest rates, investment earnings on bonds decline. In an effort to raise investment earnings, some life insurers shifted funds out of investment-grade bonds into inherently riskier but generally higher-earning assets, such as asset-backed securities (ABS), collateralized loan obligations (CLOs), derivatives, and real estate.”)
Higher-for-longer interest rates would allow allocators to shift money into less “risky”/volatile asset classes while still earning acceptable returns in line with historical inflation-adjusted stock market averages of around 7%14 (it may even end up the case that bonds simply emerge as the best house in a bad neighborhood if the Shiller P/E ratio ever normalizes due to structurally falling interest rates becoming no longer the norm).15
(https://proactiveadvisormagazine.com/the-efficient-frontier-fails-the-test-of-time/; https://www.investopedia.com/terms/r/risk-curve.asp; historical efficient frontier curves. Imagine we make a move similar to that from the 1969 curve to the 1979 one.)
Such a shift would also put pressure on borrowing costs for margin trading that has grown incredibly over the last 20yrs16.
This isn’t to say that trading in the credit markets doesn’t ever involve the use of margin17, but, the way I see it, bond markets in general could endure market-wide increases in margin rates and leverage costs better than the overall derivatives markets over time. Since bond yields tend to positively correlate to Fed interest rate moves18, their income generation aligns more directly with the broader rate environment (vs, say, the returns from trading equity and index futures). So while no area would totally avoid the gravitational force of a higher “risk-free” rate, fixed income and the exchanges like MarketAxess facilitating their trade are intrinsically better positioned if rates and leverage costs rise or remain elevated relative to our previous decade.
Sea Change
“[Q]uantitative easing caused significant changes in client asset allocation over the last three or four years, and the net result was underweight fixed income because of the zero interest rate policies around the world that has now changed. So I think what you're seeing is the very beginning stages of people starting to reallocate into fixed income, and you see it with the mutual fund inflows kicking off the year, the retail numbers are way up, the ETF assets are growing and a lot of this is driving small tickets. Some of that retail money is coming into SMA accounts, some of it into ETFs, but all of it with just this massive growth in tickets. So it’s not an option to automate, it's a requirement.” —- Richard McVey, MKTX CEO and Chairman, 2022Q4 conference call19
(https://www.barrons.com/articles/vanguard-total-market-bond-etf-6db9f488)
Oaktree’s Howard Marks has published several interesting memos on what he describes as a coming “sea change” in the capital (and specifically, credit) markets that has been pretty widely circulated. You read them for yourself here: https://www.oaktreecapital.com/insights/memo/sea-change; https://www.oaktreecapital.com/insights/memo/further-thoughts-on-sea-change.
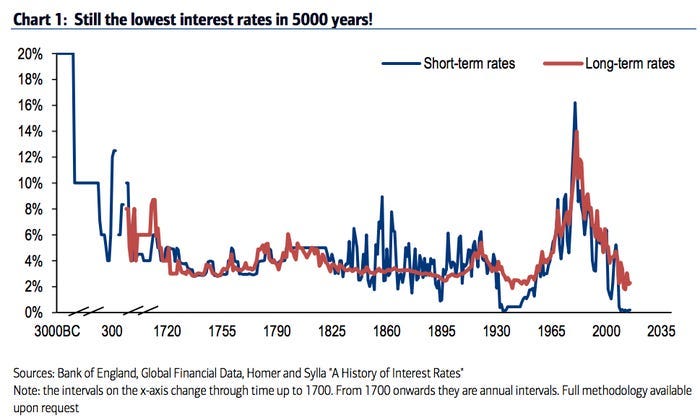
Interest rates over the past decade have been zero-bounded at the lowest level in the last 40 years (or the last 5000 years according to the Bank of England), declining by over 2,000 basis points between 1980-2020. This drove massive asset price appreciation and easy profits from leverage/risk assets as the falling rates essentially turned down the gravity on DCF valuations year after year and allowed companies to take on historically cheap debt.
(https://www.businessinsider.com/interest-rates-5000-year-history-2017-9)
“[I]nterest rates are to asset prices, you know, sort of like gravity is to the apple. And when there are very low interest rates, there’s a very small gravitational pull on asset prices. And we have seen that getting played out. I mean, people make different decisions when they can borrow money for practically nothing than they made back in 1981 and ’2 when Volcker was trying to stem inflation and use —and the government bond rates got up to 15 percent.” —- Warren Buffett [https://acquirersmultiple.com/2023/03/warren-buffett-interest-rates-power-everything-in-the-economic-universe/]
This longstanding environment has now appeared to change with inflation persisting, the quantitative tightening (QT) launched in June 2022 continuing apace20 and interest rates unlikely to reach previous lows again as the Fed tries to regain its credibility after its earlier “transitory inflation” proclamations21.
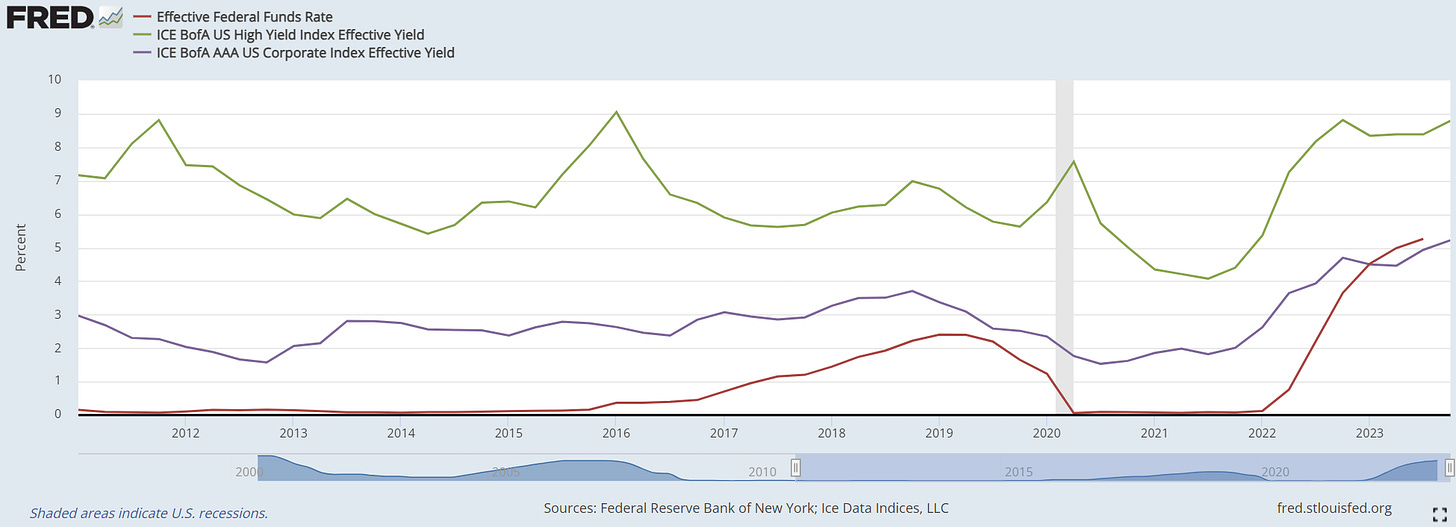
At present, yields on HG bonds are the highest they’ve been in a ten years since the 2008 GFC:
(https://fred.stlouisfed.org/graph/?g=1cxbK)
I think that Fed Chair J. Powell is, as most people are that reach a certain levels of success in their lives, reflecting greatly on his legacy and as such wants to be remembered as a Paul Volcker rather than an Arthur Burns, erring on the side of harsh rate hikes and QT to crush inflation —crushing it both on paper and in people’s minds (whether rates are themselves are even going to be a sufficient tool to achieve that is another question).22
These rising rates and the end of cheap money mean lower asset price returns as elevated risk-free rates weigh on valuations across the entire market and lead to slower growth and higher default rates for business as the cost of leverage rises and firms need to roll their debt over at these new rates —many of whom have only been limping along all this time on the infinite blood transfusions that were the low-interest debt available through the last decade23.
As I mentioned earlier, zero-bound interest rates through this last decade pushed more investors into riskier asset classes in search of sufficient yields (pension funds and endowments typically needing returns of something like 5-8% per year). If the trend continues to reverse as it has been, then many strategies that worked in the past 40 years will have very different return characteristics going forward. At the same time, credit markets can now offer similar returns that were historically only available in equities, but with higher cash flows and lower volatility —owing to their generally higher position in the capital structure and contractual returns— against a backdrop where, as Marks puts it, “lessening of optimism will throw some sand into the financial gears in a variety of ways, some of which may be unforeseeable”.
(https://fred.stlouisfed.org/graph/fredgraph.png?g=1cMh7)
(A beautifully organized and necessary diagram, I know)
.
One way to express the expectation of this shift in allocation towards the credit market (or to express to what degree you think this “sea change” is plausible) is to own the exchanges that facilitate the electronic trading as some size of an investment portfolio. As credit markets grow and electronic trading increases, trading venues will benefit from structurally higher volumes. Firms like MarketAxess and Tradeweb have upside if the sea change thesis holds, with MKTX’s valuation at 7-8yr lows as I write this (though not for no reason, as I’ll briefly cover later).
I think Marks’ idea on the future of the credit market is very interesting and very plausible for reasons beyond his arguments in the “Sea Change” memos, see more on that here…
When prices get "real" and The Great Re-Everything'ing
So, I just finished reading Zoltan Pozsar’s Bretton Woods 3.0 (BW3) follow-on articles “Money, Commodities, and Bretton Woods 3” (MC&BW3) as well as “War and Industrial Policy” (W&IP) and — while I have a few questions about the ultimate conclusions — wanted to make some quick notes
.
Perhaps Marks, Poszar, and Ektrit are wrong and our current times prove to be quite Lindy24, the coming decade looks more like the previous than less. Considering the effect it would have on equities and the credit market as a whole if rates were indeed to remain higher-for-longer, I think Horizon Kinetics’ idea of “contingency investing” (mentioned in their Q3 commentary) is something to take into account here (you could also call this convexivity investing). In this case we’re thinking about the general expectation value of a structural sea change occurring; thinking about the direction of (fund flows in/out of) the equity and credit markets, the magnitude of that change, and the (IMO, very non-zero) probability of that outcome occurring.
From this POV, I think it makes sense to invest in some basket of investments that are under- or even fairly-valued in the existing paradigm, but where the expectation value of certain underlying call-optionality (under certain unanticipated future situations that are vastly different from that currently being experienced by the wider market) is not been priced in. I think the high operating leverage and exposure to the credit markets in a price-direction-agnostic way (lessening the branching logic that we’d need to get right about specifically how a sea change would play out) makes MKTX an attractive candidate for such an investment.
“What if there were only a 10% chance that the analysis proves correct? Do you play that game of chance and accept the consequences as fate? Isn’t that what diversification is supposed to guard against? Investment professionals are expected to practice and recommend such diversification as a matter of reasoned prudence. It is acknowledged imprudence to parsimoniously avoid paying the few-thousand-dollar annual premiums for life or homeowner’s insurance. Even though such insurance is predicated on the extreme unlikelihood of a major risk coming to pass. One pays because its arrival might be catastrophic in the absence of contingency planning.” —- Steve Bregman, Horizon Kinetics Q3 Commentary 2023
.
Many in the market believe that inflation is basically licked and believe —maybe better described as hope— that the Fed will pivot on rates (or at least pause the hikes in a sustained way) and that the economy will return to the zero-bound rate environment that has characterized the last decade. I have a difference in opinion from Mr.Market, who seems to think there’s virtually no chance that rates remain at their current levels (much less rise) going forward into 2025.
(https://www.cmegroup.com/markets/interest-rates/cme-fedwatch-tool.html; snapshots taken a few weeks before and after the most recent Dec 12 FOMC meeting)
Notice that the futures market consensus is pricing in essentially a 0% chance of higher rates by the end of 2024 and only some infinitesimal chance of rates even remaining at their current levels, so, if anything, higher-for-longer is at least the contrarian take. The value of this is that we can be a bit more confident that the call-optionality of investments that might benefit from an unanticipated “sea change” future is not yet being priced in (or being priced at a heavy discount).
The way that the CME FedWatch tool creates this probability distribution is inexact25, but the point is that, in terms of general direction and magnitude, the market is expecting rates to go down over the next year and by a significant amount (say, -30% from 525bps to 375bps). I simply think it ain’t and would like to make some contingency investments to express that.
One might point to the fact that both the FOMC members themselves and CME futures market seem to agree that rates should (or will likely be) lower going forward —and it’s a pretty tight cluster of consensus as the Fed dot plot goes out (and downwards) beyond 2025.
To that, I would point to this analogy from Powell himself in 2019:
“At other times, when uncertainty around the outlook is unusually high, I dutifully write down what I see as the appropriate funds rate path in the most likely scenario, but I do so aware that this projection may be easily misinterpreted, for what is "most likely" may not be particularly likely. Very different scenarios may be similarly likely. […] For now, let me leave you with a cautionary tale about focusing too much on dots. Here is a picture composed of different colored dots (figure 2). The meaning of it is not clear, although if you stare at it long enough you might see a pattern. But let's take a step back (figure 3). As you can see, if you are too focused on a few dots, you may miss the larger picture.” —- Chair Jerome H. Powell, At the 2019 SIEPR Economic Summit, Stanford Institute of Economic Policy Research, Stanford, California26
(The figures in question, below:)
What Powell seems to be saying here is that FOMC members, in uncertain times, tend to fill the dot plot in the summary economic projections based on the specific future scenario that they think is most likely of all other individual scenarios even if the sum total probabilities of all plausible scenarios in aggregate point in a very different direction than the specific future they are endorsing in the dot plot; the biggest slice of a pie might be apple even though most of the whole pie is mostly cherry.
FYI, the FOMC members didn’t expect we’d be even past 2% rates at this point (again, we’re currently around 5.25%) back in 2021 (when rates were 0.08%):
(https://www.federalreserve.gov/monetarypolicy/files/fomcprojtabl20211215.pdf; https://www.federalreserve.gov/newsevents/pressreleases/2021-press-fomc.htm)
Will J. Powell kill this current rally with more rate hikes? The recent rally in the stock market would seem to be a great excuse for Powell to continue raising rates next year and he’s taken the opportunity to do it the recent past.
(https://fred.stlouisfed.org/graph/fredgraph.png?g=1c6uQ; some past rally-ending rate hikes)
“My personal view is probably you know if the market gives him [Powell] room to do 100 basis points, he will take that; that’s where he’s very different to Yellen. If the market will give him room he won't ignore it. They want to front load as much as possible because there’s this window up until that point where the White House affiliated members of the FOMC —and we know who they are, anybody affiliated to the San Francisco Fed is white house affiliated— [will turn dovish] […] I think the last thing you will hear about if things get very scary on the economic front and there’s a lot of pressure applied to the fed the the thing you will hear least about is the quantitative tightening and I think it’s just going to run in the background” —- Nicholas Glinsman
MarketAxess
With a marketcap of around $8bn and covered by at least 12 wall street analysts, MarketAxess is certainly no underfollowed microcap and I do think that the market is usually right. However, I think the market share decline issues that have been a drag on the stock price are —because MKTX is such a large company— already priced in. On top of that, I think that the market is greatly discounting (for the reasons described in the previous section) the optionality of rates remaining as they are or continuing to rise in the long-run, acting as a further impulse towards the long-term asset allocation shift that Howard Marks expects. (I’d guesstimate an 80% chance of higher-for-longer rates and 60% chance of the same for inflation; as much as hedge funds may be praying for it, I reckon a Fed pivot isn’t in the cards).
In the interest of diversification, I’d like to allocate my portfolio for beneficial exposure to all of the various possible economic environments/futures —while trying to limit the downside in the various investments if the expected futures don’t come to pass— and I think the beaten-down MKTX is a good higher-for-longer, sea change hedge at current levels. The new CEO seems to think so as well.
Quick business overview
Founded in 2000, MarketAxess (MKTX) operates a leading electronic trading platform for US corporate bonds and other fixed income securities. Additionally, MKTX provides broad exposure to global debt markets and derivatives across currencies (via Euro and EM bonds), interest rates, credit, and other asset classes, making it an effective way to access and hedge risks across multiple fixed income sectors. We are seeing a big shift in interest rates and credit markets after over a decade of declining rates. Rates are now moving higher (and I think are staying there), which marks the end of an unusually favorable decade (and possibly four decades) for borrowing and asset appreciation.
As mentioned in the HK commentary, exchanges have a croupier-like business model where they collects fees for providing the venue and tools for (in this case, fixed income) trading, without taking on significant balance sheet risk. MKTX is no different and is poised to benefit from higher credit spreads and increased volatility that typically leads to increased trading activity. MKTX enjoys high margins and stable revenue growth from the trading activity on its platform and its operating leverage means volumes translate into revenue with limited incremental cost and with networks effects that keep clients on the platform that leads to improving liquidity and draws in even more clients in a positive feedback loop. MKTX’s revenues and profits have historically been resilient or even counter-cyclical in periods of market stress (revenues falling less than 1% during the 2008 GFC and growing through the 2015/2016 market selloff27 and 2020 COVID panic).
With higher interest rates and prospective long-term returns on credit instruments becoming more competitive vs equities, there is likely to be a shift in asset allocation and investing strategy. This should drive more capital into fixed income which will translate into greater trading volumes and revenue growth for MarketAxess over time. I don’t think this higher-for-longer call optionality is being priced into MKTX (or much into anything at the moment).
.
MKTX primarily makes its money from providing efficiency, transparency and liquidity to the credit market for its clientele of asset managers, dealers, and retail investors via its RFQ28, CLOB29, periodic auctions, and all-to-all Open Trading protocols30 and automated trading solutions (eg. Auto-X RFQ and Auto-Responder), earning commissions on the volumes traded across the platform. Like most other exchange businesses, it collects these fees on the trading activity of participants with very little balance sheet risk to itself (the company has no debt and de minimis capital lease liabilities).
(https://www.instinet.com/destinations-of-choice; This is a useful visualization of under what kinds of situations the different types of trading protocols would be preferred (with MKTX’s Open Trading all-to-all protocol being used within a similar area as the Order Book methods in the graphic))
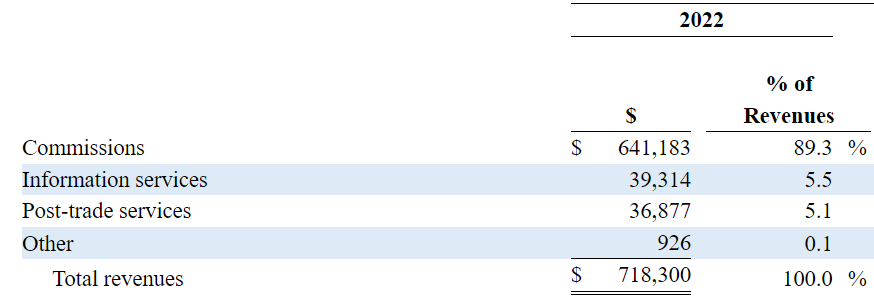
In 2022, 89.3% of revenues were derived from commissions for transactions executed on MKTX platforms, 5.5% of revenues derived from data products, and 5.1% of revenues were derived from post-trade services (eg. reporting and regulatory compliance services).
(MKTX 2022 10K)
MKTX is the dominant player in the US corporate bond market in terms of market share, but that is being challenged by competitors like Tradeweb and Trumid (which is a much smaller exchange being backed by large players like Citigroup, Goldman Sachs, and Barclays) —I believe MKTX is also the dominant player in EM debt trading as well.
(https://www.sifma.org/resources/research/understanding-fixed-income-markets-in-2023/)
.
“The corporate bond market has certain unique characteristics that make it different. A firm typically issues at most two types of shares (common and preferred), but may have dozens of bonds outstanding that differ by maturity, issue date and the degree of seniority in the firm’s capital structure. Given the dizzying variety of bonds, any individual one is traded only rarely. In fact, 90% of corporate bonds trade fewer than five times a year.” —- https://www.economist.com/the-economist-explains/2017/05/01/why-are-most-corporate-bonds-still-traded-on-the-phone; https://archive.ph/JOPcp#selection-957.0-957.445
Bond market trading has been much slower to adopt electronification/automation than the equities market, with the majority of bond trading still done over the counter in bilateral negotiations (historically done manually over the phone, “voice brokering”), creating a long remaining runway for MKTX (and rivals). The primary reasons for this slow digitization and adoption are…
Fragmentation of products: The immense diversity of credit instruments across corporate bonds, municipal bonds, MBSs, and ABSs etc. makes standardization very challenging. Something to note about the credit market vs equities is that credit products can be much more numerous and diverse than what is normally seen in the stock market. A single company may have only a single class of shares (or even several classes that all generally trade in a similar manner with only a difference in shareholder voting rights or how distributions are rationed), while that same company may have many dozens, hundreds, or thousands of credit instruments outstanding all structured completely differently from each other. (For example the Ford Motor Company and Exxon Mobile have 25 and 29 different outstanding bonds issued, respectively)31.
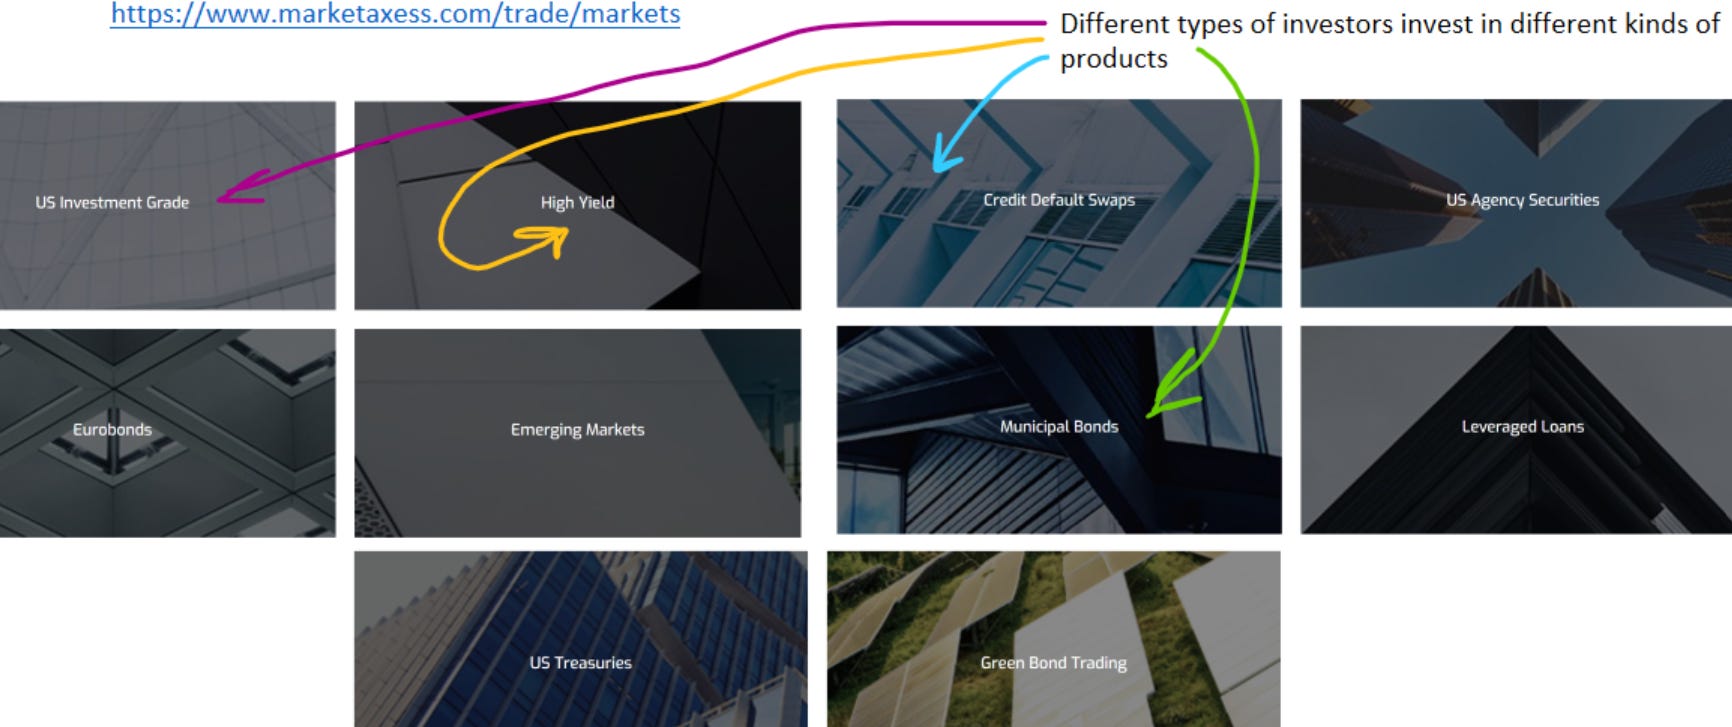
Greater diversity in contractual terms: The different payment rules, risks, and embedded options within each security type further complicates building common trading protocols that work for everybody. On a related note, the types of investors, with very different needs, can differ greatly even between types of credit products (eg. between US HG, USTs, and municipal bonds) in a much more significant way than, say, large hedge funds that invest primarily in tech stocks vs those that invest in industrial stocks or even ones that focus on spinoffs and CVRs, etc.
Historically decentralized structures: Much of the historical credit trading has been over-the-counter between counterparties rather than on centralized exchanges, contributing to digitization difficulties. Maybe call it legacy inertia.
Sporadic liquidity: The clientele of credit market exchanges have greatly different behaviors to those in the stock market, with many credit instruments being held for income purposes and thus held to maturity, which greatly impacts market liquidity and the timeliness of price signals. This sporadic liquidity likely also reduces incentives and urgency to demanding electronic trading capabilities.
Regulatory complexity: Credit markets must abide by distinct regulators across products (SEC, FINRA, The Fed, MSRB, etc.), slowing coordination required for modernizing market infrastructure. On the plus side, these cumbersome regulatory requirements also present opportunities for post-trade reporting and compliance services, allowing exchanges to leverage their data and monitoring investments and helping to insulate the industry from disruption. “Regulation always benefits the incumbent”, Bill Gurley.
Risk management: Concerns around managing counterparty risk alongside debt default risks lead market participants to move cautiously in making foundational trading changes.
All of these issues have resulted in a very slow electronification process in the credit markets, with less than half of the entire HG market trading volumes occurring digitally.
“Roughly 40% of investment-grade and one-third of high-yield corporate bonds now trade electronically, both metrics having doubled in only the past three years.” —- https://www.sifma.org/resources/research/understanding-fixed-income-markets-in-2023/
Further reading: https://www.bis.org/publ/qtrpdf/r_qt1603h.htm
.
MKTX has remained FCF positive since its IPO with a 18yr CAGR of 17% and, aside from a less then 1% decline in the 2008 GFC, has never had a year of revenue decline —growing through the 2015-2016 market selloff32 and spiking significantly during the market panic of the 2020 COVID lockdowns.
The bulk of MKTX’s expenses come from SG&A, depreciation & amortization (mainly for software development costs), and technology costs (tech subscriptions and cloud hosting costs), all of which tend to be quite low relative to revenues.
(Again, not that those drastic drop-offs in gross margins in certain years of MKTX’s history are only due to TIKR data confusing certain opex items for COGS in those years for some reason).
Counter-cyclicality
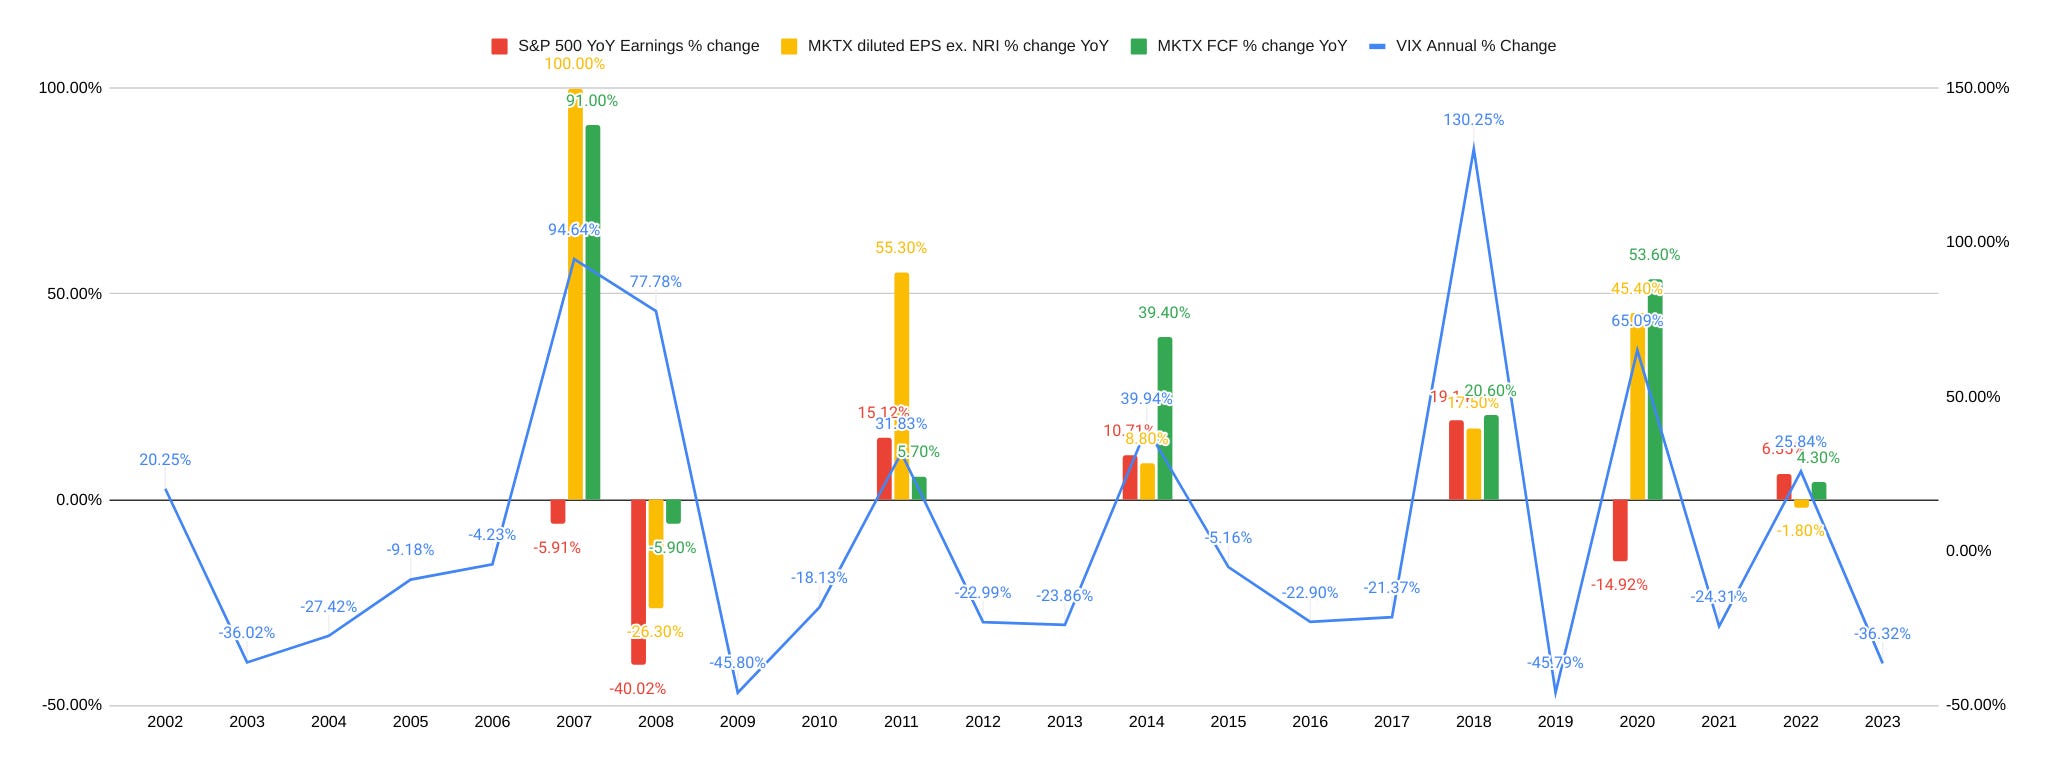
Since MKTX profits from increased trading activity (vs the overall direction of that activity), it’s earnings are often buffered from volatility in the wider market —and I assume also helped by a greater shift into fixed income during times of stress in the equities market. Below we see MKTX vs S&P 500 during various market sell-off over the last 20yrs as well as across spikes in the VIX volatility index:
MKTX has also tended to benefit —vs the market— from high or rising interest rates:
(I kinda ignore the early 2000s data as MKTX was still getting into its stride as late 2004 was its IPO, but if there’s a more noteworthy/fundamental reason for those large earnings dips do let me know).
Management
Founder Richard McVey owns 1.44% of outstanding shares (amounting to around 65x his 2022 total cash compensation) and has led MarketAxess for over 20 years as Chairman and CEO, focused on expanding liquidity and products, maintaining MKTX’s leadership position, and gaining the company an entrenched position in the pooling of electronified bond trading. Acquisitions have also expanded their reach across adjacent fixed income assets. McVey recently stepped back from the CEO position, with Chris Concannon taking on the role in April 2023, increasing his stake in the company by 10% later in the year (or 57% of his total 2022 cash compensation (1018/(500+1300) = 56.6%) to a total of 47000 shares (7x his 2022 cash comp).33
(https://www.sec.gov/Archives/edgar/data/1278021/000120919123045833/xslF345X03/doc4.xml; 47000/(43000-104)-1 = 10% increase in shares, bought at an upper limit of $240/sh)
Here’s a look at the exec comp breakdown:
(https://www.sec.gov/Archives/edgar/data/1278021/000156459023006295/0001564590-23-006295-index.html)
Other than the “Adjusted Operating Income Performance Grid” in the proxy, there doesn’t seem to be any info on what the hard numbers were for these various performance targets. In terms of how appropriate these performance metrics are, from a scale of 1-3 with 1 being ‘highly in management’s control’ and 3 being ‘totally un-attributable to them for better or worse’, I’d say…
Adj. operating income: 2
Contributions to strategic objectives: 2 (fuzzy, but directionally OK)
US credit market share: 1, this is nice as market share growth a major driver of the business’s earnings
Revenue growth: 2.5; a lot of factors contributing to total credit market trading volumes are not necessarily in any individual companies control.
Operating margins: 1.5; would have liked to see something more closely tied to FCF and acquisition profitability here.
Stock price performance: 10, 🤮; I am reminded of this video from Warren Buffett on the idea of linking an executive’s compensation to something they have no control over:
Below, we can get a view as to how management has spent cashflow through the company’s history:
(Yes, I know FCF accounts for capex, but I include it here anyway just to get a sense of how cash is being spent, overall)
One thing I like to see is companies that actually bought back stock in 2007, 2008, and the 2020 market panic (many panicked and sold assets or found themselves desperate for cash and issued stock at that time). The bulk of MKTX’s 2020 stock buybacks in that year were in Q1 and Q2, so one can be reasonably comforted that they were not just following the herd in the market run-up that occurred in the 2nd half of that year. I’d also note that MKTX’s quarterly dividends continued apace through every quarter of 2020.
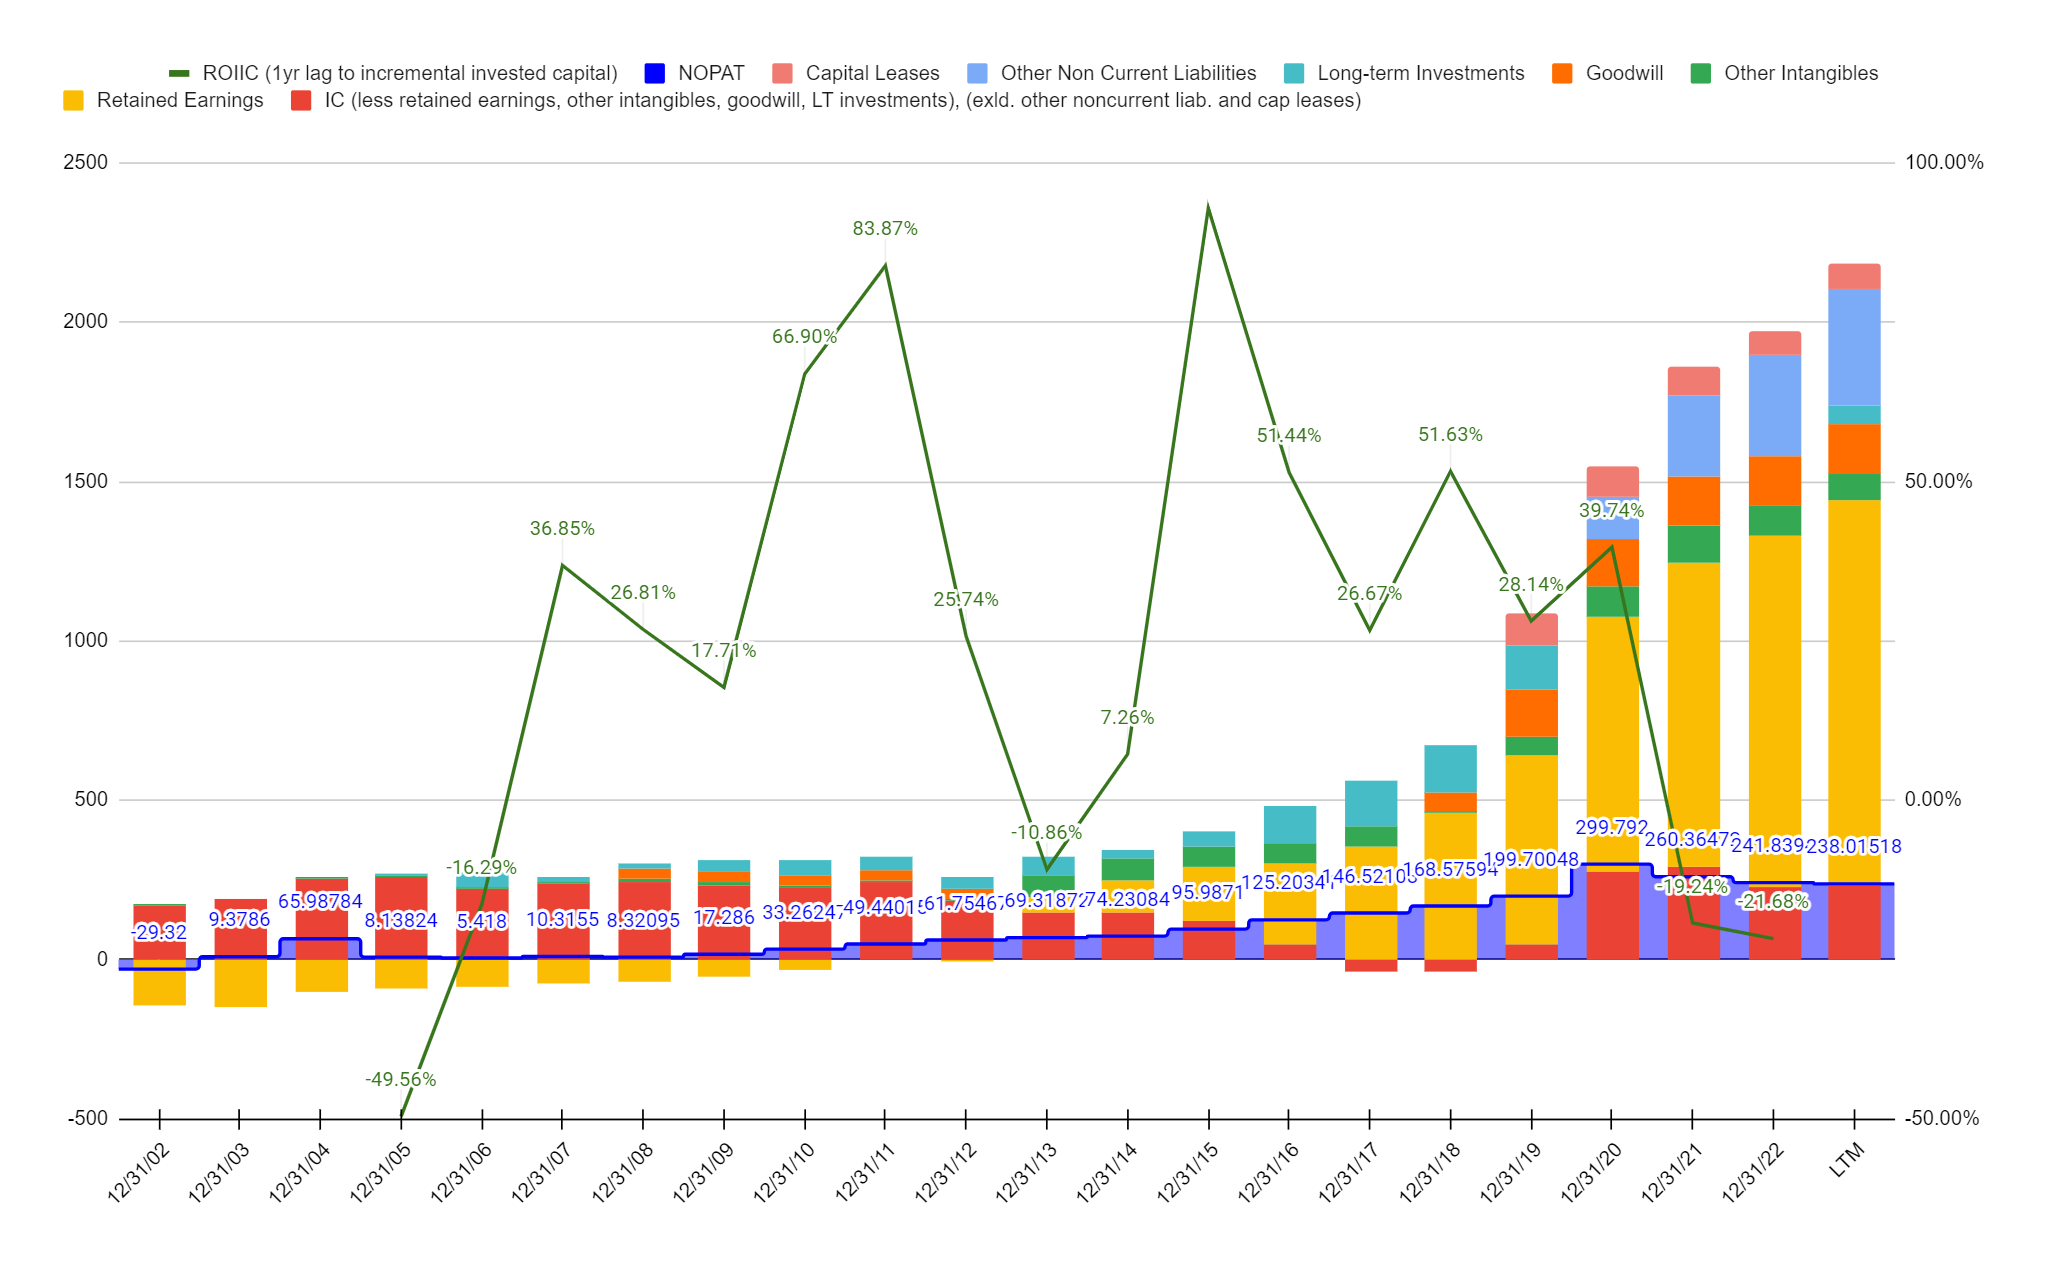
In this next chart we can see a breakdown of MKTX’s total invested capital as well as the return on incremental invested capital (ROIIC), in this case using a lag of 1yr, so if ROIIC at the end of 2020 is 40% it can be interpreted as saying that the incremental capital invested into the business by the very beginning of that year (using the IIC data from the end of the previous year, 2019) generated a 40% increase in NOPAT:

(MKTX acquired Xtrakter in 2013 (post-trade data services), LiquidityEdge in late 2019 (USTs), Regulatory Services GmbH in 2020 (European post-trade data services), and MuniBrokers in early 2021 (municipal bonds)).
Something to keep in mind here is that MKTX makes most of it’s money from commissions on US HG/HY trading (and the credit side of the business in general) and the business has very high operating leverage, so it’s not always obvious how much growth in a given year can be directly attributed to management’s capital allocation (I made ROIIC charts with 2- and 3yr-lags as well, but they don’t look any smoother). For example, due to the volatility in 2020, it could be argued that nothing management did in 2019 really contributed much to the revenues and credit market volumes in the following year; the bucket was already/always outside and it just happened to start raining. Furthermore, having a single high-performing business like a dominate, asset-light US HG/HY exchange could, from an aggregate perspective, mask unprofitable M&A excursions. So looking just at ROIIC and IC data is a bit low-resolution and may require drilling into specific years and thinking about what was happening with the credit markets and volatility in those years to get a better sense of how management is contributing to incremental profit gains over time.
Valuation
Again, MKTX is a well covered stock and we can look at existing analyst price targets and estimates of forward FCF/sh to get a sense of how the stock is being priced relative to those estimates.
… and here’s the average price target just a few days later as I’m writing this draft; really, what could have materially changed for the business in the intervening 6 days that changed the value of the business by $2.50? The Fed not raising rates on the 13th?34
Below, I just extrapolate the Wall Street analysts’ 25% CAGR out by five more years, bring it down to a flat 20%, and plug that into a simple DCF model to see what kinds of additional assumptions would need to be made to result in a valuation similar to the current price.
(https://www.gurufocus.com/stock/MKTX/dcf)
I think the assumptions here are not too crazy and so MKTX is probably within a range of being fairly valued. I think paying fair value for this high quality business is fine as it also comes with the discounted upside call-option of benefiting from an asset allocation shift into credit.
The stock traded around a 25x EV/EBITDA at the time I started buying (but has come up quite a bit in the, IMO, short time it’s taken to draft this post, sorry)35, below COVID 2020 levels and in line with 2016 valuations, and at a discount to competitor Tradeweb (which makes sense given the growth and market share issues).
Why is it cheap/depressed?
Starting around 2021 MKTX growth and market share issues vs newcomer Tradeweb (TW, which IPO’ed in 2019) have weighed on the stock price.
(https://x.com/UpslopeCapital/status/1699612907754168570?s=20; https://twitter.com/UpslopeCapital/status/1445748681064345608)
Looking at the monthly market share data for the rest of 2023, we can see MKTX remaining generally competitive in HY and continuing to struggle in HG bonds.
(BTW, if anyone knows how to get this historical volume and market share data beyond the (incomplete) current year data that MKTX has on their website or just manually going through each month’s volume press releases, do let me know).36
Notice that MKTX’s market share capture remains relatively stagnant, while TW continues to make gains —likely explaining the premium multiple that TW currently trades at over MKTX. (Bond traders are probably happy to be dealing with a more balanced oligopoly, though).
I think further market pessimism on the stock has been driven by the fact that management seemed for a good while to be pretty unfazed by their static market share growth. From the 2022Q4 conference call:
(Analyst) Christopher Allen:
I wanted to followup a little bit on the high-grade side.
One of the -- basically the one pushback we're getting on the stock now is just that the market share of high-grade has been pretty static if you kind of look at it over the last three years, right around 20%, 22%. I was wondering if you could provide any color there, particularly in the context of recent quarters you see in the average trade size coming down, which should be helpful for your market share of high-grade. I'm just wondering if there's any dealer activity in terms of balancing share on high-grade versus high-yield where you're seeing good gains there, or there's some other factors apply?
(CFO) Chris Gerosa:
Yes, Chris, I'm happy to take that one. And I think the way to think about high-grade is, we are seeing record levels of activity even in the fourth quarter in our Open Trading all-to-all solution.
So we are seeing gains in terms of Open Trading hit 33% of our total volume in Q4, so we are seeing gains there.
We are also seeing gains in our portfolio trading solution in high-grade. We had record volume in PT in high-grade of $17 billion up close to over 90%.
So we're making gains. Obviously direct dealer RFQ has been running flat for us.
We also made gains in our dealer RFQ, sorry, was up 23%. But when I look at high-grade and high-yield full U.S. corporate credit, the overall activity from our clients is still positive and you're obviously seeing those big gains in high-yield. But again the high-yield gains are driven by our Open Trading volume which ADV grew by 43% in the Q4.
So, overall credit activity on the platform is showing signs of substantial growth, particularly driven by Open Trading.
And another:
(Analyst) Kyle Voigt
Okay. and just for a followup, just taking a step back, if we were going to kind of rewind maybe five years ago and think about the opportunity that you had in high-grade and high-yield from a market share standpoint, I don't think anyone would have guessed that you would have effectively had the same market share in both as we sit here today.
So I guess the first part of the question is, just given the different liquidity dynamics in these two markets, do you still think that high-grade total electronic share will ultimately settle at a higher level than high-yield over the long-term?
And, just to follow up on Chris Allen's earlier question, is there some level of market share where it just gets harder for a single player to gain incremental share? Is that playing into anything that's happening in high-grade at all, because obviously the high-yield dynamics seem much different right now with the momentum there?
(COO, at the time) Chris Concannon
So first on electronic share and electronic adoption across the fixed income market, I do see that over, we will see differences in adoption across the various products that we offer.
So obviously investment grade has seen the highest adoption of electronic trading, high-yield is growing rapidly, particularly on our platform.
If you look at emerging markets, the opportunity is one of the largest opportunities globally.
But we're seeing higher adoption rates there, particularly in 2022, where we have record shares, record share in both TRACE and global EM market share, estimated market share.
I think munis is probably one of the most interesting product for electronic market share is probably in the most need of electronic adoption, particularly given the size of the average ticket in munis and we've seen -- we had a record year of adoption in munis, both record market share and record ADV.
I would say that we look at it holistically across the entire fixed income landscape, not just one product.
Our clients don't trade just high-grade. They trade across the entire fixed income landscape.
So when they -- we think about electronic adoption, it certainly can achieve in my view, the 90% rate that we see in other asset classes, because at one point in the electronic adoption evolution you get to a point where you have to go all the way, not just part of the way, and your workflows become fully automated and fully electronic.
So I predict very much higher levels of electronic adoption across high-grade, high-yield, emerging markets, and in particular munis and obviously we think we will play a key role in that. When our clients are outsourcing trading solutions, they're not studying market share by product like we all do. They're studying that solution and the quality of execution that's being delivered on the other side. Hopefully that answers your question.
(Chairman) Richard McVey
Just one, add on too, Kyle.
I think with high-yield in particular, the liquidity challenges in the U.S. credit markets were most pronounced in high-yield and that plays right to our favor. And what I think it's showing you is that when liquidity is challenging, Open Trading is significantly differentiated from any other way of conducting trades in the high-yield market or elsewhere. And anecdotally, you'll hear stories of challenges in inventory, in the leverage loan market, in the high-yield market that creates constraints around balance sheet for secondary trading and the high-yield market, I just think is another data point that shows that we have a unique solution for liquidity through Open Trading that people are not able to find elsewhere. And I think that just positions us great for market share gains for many years to come because of the investments that we have made there.
The thing to notice here is what’s not there, that being any sense of great motivating concern about the HG market share issues. Management seems to be rather blasé towards the lack of market share growth in HG corporate bonds. Gerosa dodges directly answering why HG market share has stalled, instead pointing to growth in other segments; Concannon and McVey acknowledge the issue but seem to brush it off and redirect, neither directly explains why high-grade share is stagnant. Instead, they reframe the HG issue and impress how they view market share holistically across products —one might get the impression they are retreating from the competition into other categories. I’m not a great reader of people, but management seems to consistently evade directly answering why market share capture has stalled and instead pivot to discussing strengths in other areas like HY and Open Trading.
MKTX isn’t beaten down for no reason.
Management appears to take the issue a bit more seriously in the more recent 2023Q4 call; acknowledging the “market share challenge” and that they “not happy with current growth rates in U.S. credit”, while covering their rollout of X-Pro and Adaptive Auto-X to capture volumes through greater support of portfolio trading protocol37 and automated AI-assisted trading, respectively. Nothing in management’s comments appear to signal any major strategic shifts or initiatives, but it’s something and the October and November volume data shows positive momentum in YoY market share gains for HG. (These seem to be the only material events preceding MKTX recent stock run-up that I could notice, but if there’s anything else do let me know).38
Catalysts
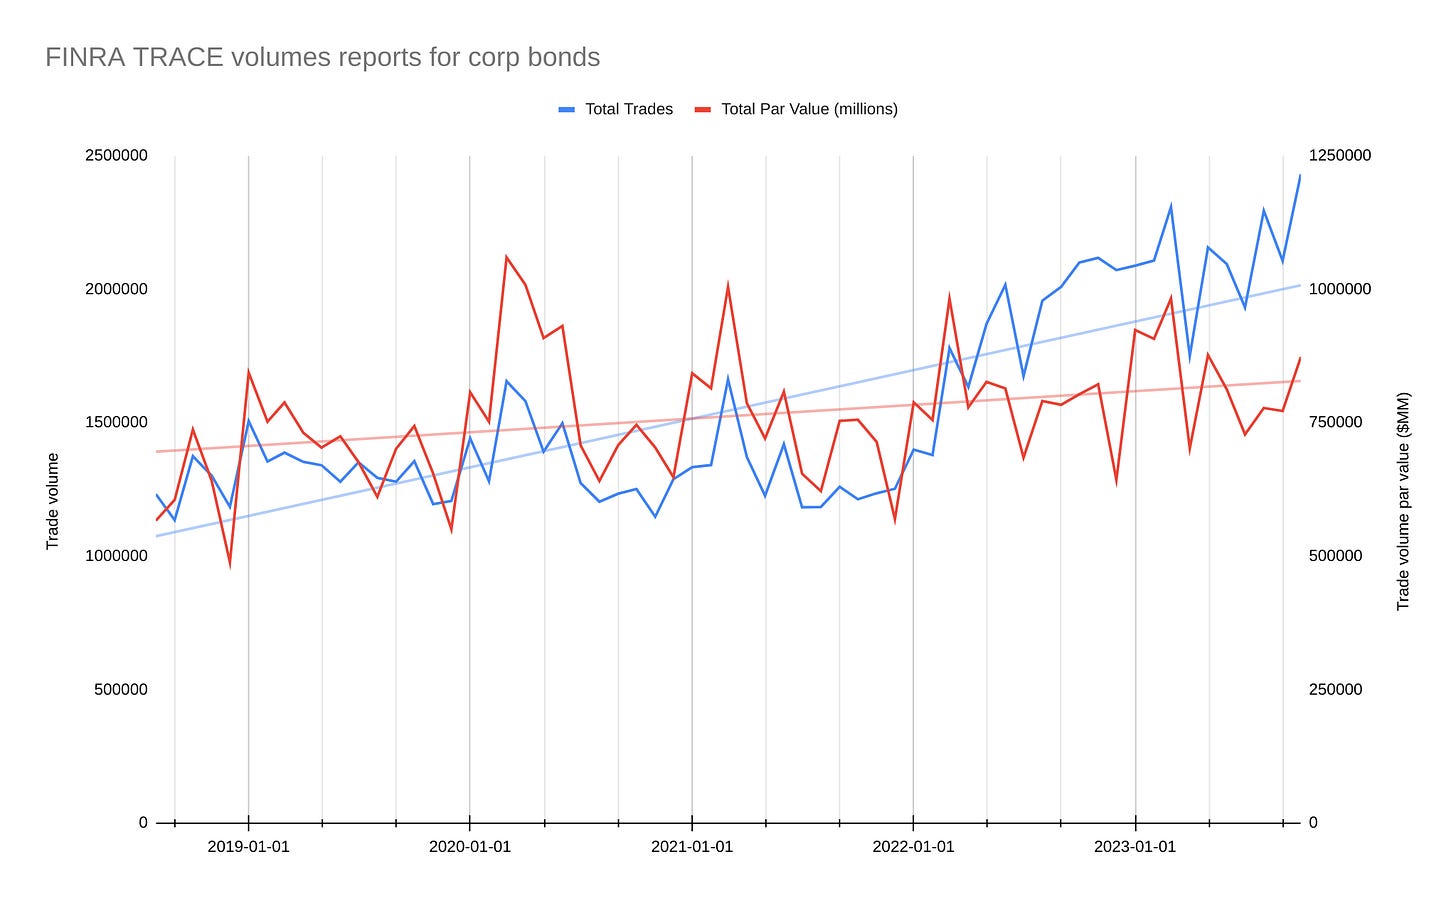
Rising rate since 2022 have already appear to have boosted bond trading activity.
(https://www.finra.org/finra-data/browse-catalog/trace-volume-reports/trace-volume-total-trades)
Aside from the long-term Sea Change call option that I think is quite likely, we have…
.
… A considerable backlog of debt maturing in the coming years that will have to be rolled over, translating into fresh batches of HG bond issuance into the market:
Of course, the coming debt maturities at existing higher rates could actually end up being a cause for lower rates if it results in a massacre of zombie companies39 that may have previously found it difficult to go bankrupt in the previous ZIRP environment of the past decade, despite not generating enough cashflows to cover their debt payments. If enough of these companies are pushed into insolvency, it may stir Democrat-aligned FOMC members to argue for cuts heading into the 2024 election year.
This seem to be the general view of Pershing Square’s Bill Ackman when discussing inflation and current interest rates, recently:
“And I think that is having a retarding effect on the economy. And then of course, many businesses and many individuals have the benefit of fixed-rate debt. And that fixed-rate debt, certainly for companies and commercial real estate starts to roll off, so I think there’s a risk of a hard landing if the Fed doesn’t start to cut rates pretty soon.” —- Ackman, https://www.linkedin.com/pulse/bill-ackman-warns-economy-fall-off-cliff-fed-doesnt-hurry-5ge1c/
But one should also remember that this is the same Bill Ackman who, in 2020,…
“quietly placed a bet that stock markets would tank. Those bets made his hedge fund $2.6bn (£2.2bn) – a near-10,000% return on his $27m stake. Ackman’s extraordinary doom-laden appearance on CNBC, in which he revealed he had evacuated his family and colleagues from New York City and said he expected the virus to kill close to a million Americans, spooked financial markets, sparking immediate frenzied selling.
[…] Ackman [later] revealed in a letter to his shareholders that since late February he had been buying “credit protection” hedges – bets that the markets would fall. Those hedges have paid off and Ackman’s fund used the gains to buy shares in ‘companies we love at bargain prices’.” —- https://www.theguardian.com/business/2020/mar/27/hell-is-coming-how-bill-ackmans-tv-interview-tanked-the-markets-and-made-him-26bn
.
The bond market still largely does trading non-electronically, so there remains a big runway for secular growth in electronic trading (iff MKTX can start getting proactive about gaining market share in their bread-and-butter HG space).
.
Management taking more and more significant steps to get HG market share back into growth mode. I’m taking a wait-and-see stance on this one, but plan to DCA more into the stock as more progress on this issue starts being made —I think this is the plan of many other investors as well.
Risks
As mentioned, a lot of investor pessimism is currently related to MarketAxess’ slowing growth in market share in the face of rivals like Tradeweb who are picking up MKTX’s slack. If MKTX’s HG stagnation continues and the market share spread between MKTX and TW continues to narrow —while management jingles the shiny keys of the other credit products’ market share in investors faces each quarter— then that would be a big problem. They seem to be giving the issue more attention now than previously, but it’s something to monitor.
Of all the weaknesses in the securities exchange space, I’d rank incumbent rivalry as #1 —with the fact that volumes (the main source of exchanges’ profits) are largely out of any management’s control as #2.
.
Has most of the low hanging fruit along the bond-market-digitization runway already been picked? As the various bond market exchanges race to improve their systems and bring trading into their centralized venues, it’s possible that they will begin seeing diminishing returns in these ‘last miles’ of digitization. At some point, I expect exchanges to begin encountering diminishing returns and increased technical challenges in attracting the last remaining pockets of voice/manual trading activity.
Early digitization likely focused on the most liquid instruments and those most obvious to support over centralized digital venues. Niche fixed income securities that rarely trade or have very specialized contract terms are going to be harder to meaningfully incorporate. Bilateral voice trading preserves a lot of flexibility for negotiating complex or large block trades that don’t easily translate to centralized markets as they currently exist.
If this does indeed turn out to be the case much sooner rather than later, then TAM and growth expectations (and thus valuation multiples) are likely to drop significantly (not just for MKTX, but for all credit market exchanges). This is scenario is really not a risk, so much as an inevitability. The real risk is that the exchanges come to find that what they thought was a mile-long runway turns out to actually be just a football field on approach —and that the stock price makes a corresponding rocky landing.
There’s a reason equities have been so much faster to centralize than the bond market…
The relatively standardized nature of certain instruments, for example, equities, tend to be order driven, and trading is facilitated by stock exchanges and other venues that can match large numbers of buyers and sellers for each order.
However, markets such as fixed income and derivatives are characterized by a significantly large number of instruments with different characteristics (tenor, payment terms, coupon rates etc.), which makes matching supply and demand for a given instrument more challenging. By way of example, the number of European fixed income instruments covered by Trax alone amounts to 310,000. This compares to around 19,000 publicly-listed equities across Europe. Fixed income instruments are also by their nature purchased for income rather than capital appreciation, and some investors are less likely to trade these instruments after the initial purchase. In the absence of a continuous two-way market for buyers and sellers in these markets, market makers such as banks and broker-dealers facilitate transactions by stepping in as counterparties to such transactions by buying or selling financial instruments without an immediate matching transaction. These are therefore traded over-the counter (OTC) rather than on exchanges —- https://www.pwc.com/gx/en/financial-services/publications/assets/global-financial-market-liquidity-study.pdf
.
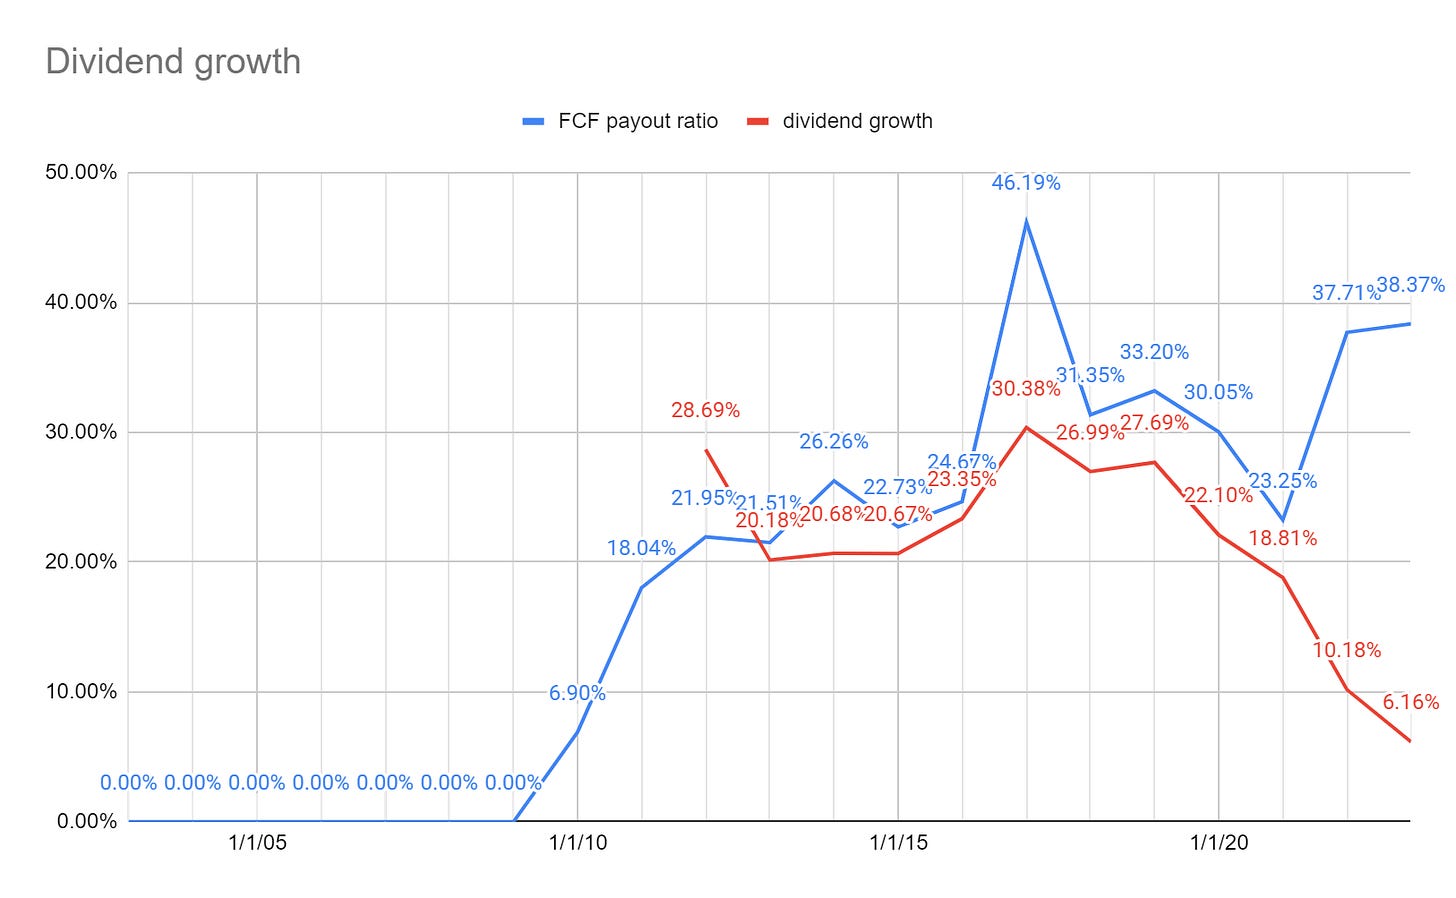
Dividend growth has also been slowing over recent years, but that may be more related to management finding more fintech investment opportunities (eg. to address the market share issues) and wanting to build a larger cash balance, as they’ve mentioned in recent earnings calls.
“So we're really talking about an M&A strategy that involves much smaller size bolt-on type of product offerings. The FinTech space has clearly been repriced. So there's an opportunity and there are a number of FinTech providers in the market that will start facing capital challenges in the year ahead. So with a very strong balance sheet, we feel well positioned to take advantage of a re-priced market with a number of FinTech players that may be in need of capital.” —- ex-CFO Chris Gerosa, 2022Q4
Though, keep in mind that payout ratios have also been rising, so the issue isn’t just solely about priorities, but of issues with funding internal growth (which indicate more stress than the redirecting-to-M&A interpretation). A rising payout ratio and falling dividend growth are more supportive of the idea that management is returning capital to shareholders as growth stalls —which it is certainly doing at the moment.
.
Less volatile, low-yield conditions would reduce overall turnover. A reversal by the Fed back to a sustained ultra-low-rates environment would temper trading volumes and revenue growth potential for MarketAxess in the long-run as the efficient frontier moves back to greatly favoring equity over bonds and allocators are compelled to remain in equities to meet return requirements.
My understanding is the etymology of the name comes from the concept of “axes” in the bond market. See more on term here: https://www.investopedia.com/terms/a/axe.asp
MKTX’s 2022 10K estimates they take 21% and 18% of total market share for US investment grade and junk bond trading volumes, respectively.
I’m personally uncomfortable in general with funds that have very strict mandates or rules set for how investments will be made. For these funds, their available capital and opportunities to make investments are often inversely correlated to the availability of opportunities due to the aggregate fear/euphoria behavior of Mr.Market that their capital is subject to.
“Through decades-long experience in the investment management business, we saw the same pattern, which is: people don’t make money in mutual funds, because they sell when it goes down or they sell when the fund underperforms. They buy after periods of high performance. Even though one is required, in a fund, to state that past performance is no guarantee of future performance, it doesn’t do much good, apparently. People behave as people behave anyway.” —- Murray Stahl, https://www.frmocorp.com/_content/letters/2015_FRMO_Transcript.pdf
“In many aspects of life, indeed, wealth does command top-grade products or services. For that reason, the financial “elites” — wealthy individuals, pension funds, college endowments and the like — have great trouble meekly signing up for a financial product or service that is available as well to people investing only a few thousand dollars. This reluctance of the rich normally prevails even though the product at issue is — on an expectancy basis — clearly the best choice. My calculation, admittedly very rough, is that the search by the elite for superior investment advice has caused it, in aggregate, to waste more than $100 billion over the past decade.” —- Warren Buffett, Berkshire Hathaway 2016 annual letter
Eg. see my previous post on CreditRiskMonitor.com
($CRMZ) CreditRiskMonitor.com: Commentary
“Given the inflationary environment in 2022, the corresponding tightening of interest rates by central banks, and the number of businesses with limited ability to cover their interest expenses with earnings, the Company expects that the number of corporate bankruptcies will at worst return to long-term average levels which will support the need for the …
Further reading from HK on croupiers and securities exchanges:
https://web.archive.org/web/20150506062559/http://www.horizonkinetics.com/docs/10-7-08%20Observations%20on%20Securities%20Exchanges.pdf (see “Observations on Securities Exchanges”)
https://milkeninstitute.org/sites/default/files/reports-pdf/Derivatives-Report.pdf (not from HK, this was just an interesting read on derivatives I thought I’d share)
I’ve written a bit more on HK’s position on this, here: https://lemoncakesinvesting.substack.com/i/56739528/hkfrmo; https://lemoncakesinvesting.substack.com/i/60550169/fftt-us-meets-em-balance-of-payments-crisis
https://milkeninstitute.org/sites/default/files/reports-pdf/Derivatives-Report.pdf
https://lawecommons.luc.edu/cgi/viewcontent.cgi?referer=&httpsredir=1&article=1025&context=luclj, “Derivatives: A Twenty-First Century Understanding”, Timothy E. Lynch, University of Missouri-Kansas City School of Law
I’ve been sitting on a draft of a post covering the possibility of massive amounts of money being used for commodity prepay and collateralization for use in margin trading by global mega-banks for a long time now. I think the idea is interesting, but I think it’s pretty ill-researched (even for my standards) and rambling (even for my standards). Maybe I’ll just publish as an April 1st thing or something if I ever get around to cleaning it up from a collection of scattered notes and links.
“But the kind of reaching for yield that Stein, Yellen, Bernanke, and Rajan have discussed recently stems from low interest rates. When nominal market interest rates are generally high, investment managers have no problem earning enough to cover their liabilities or reach their investment goals. But after a recession, the central bank may cut interest rates to boost the economy. For a while, risk premia remain elevated, pushing overall market interest rates higher, so investors have little need to search for yield. As risk premia recede, however, investors may become desperate for higher returns and shift toward riskier investments.”
https://www.bis.org/publ/bisbull02.pdf, “Leverage and margin spirals in fixed income markets during the Covid-19 crisis”
https://www.interactivebrokers.com/en/trading/margin-bonds.php
It should be noted that MKTX’s 2022Q4 call was held in January 2023; Howard Marks’ “Sea Change” memo was published in December 2022; he’s rather widely read and I’m pretty sure that McVey would have been aware of this memo.
https://wolfstreet.com/2023/12/07/fed-balance-sheet-qt-1-23-trillion-from-peak-129-billion-in-november-to-7-74-trillion-lowest-since-april-2021/; https://wolfstreet.com/2023/12/13/what-powell-said-about-continuing-qt-amid-rate-cuts-rrps-going-to-zero-and-reserves-dropping-to-a-magic-line-in-the-sand/, “We’re not talking about altering the pace of QT right now, just to get that out of the way.”
FRMO’s Murray Stahl believes that our current bout of inflation is due to supply issues and thus cannot be fixed by rate hikes of any amount and that the Fed cannot maintain very high rates even if they wanted to.
Perhaps this part is being a bit overhyped and dramatic, see https://www.federalreserve.gov/econres/notes/feds-notes/us-zombie-firms-how-many-and-how-consequential-20210730.html
You can read CME’s methodology here and well as a shorter explanation here. I recommend just going over the CME’s full explanation multiple times. I’ll just note, for now, that individual month probabilities are based on binary rate outcomes and are established independently for each contract month, based solely on expectations for that given month. Multiplying the binary probabilities across 12 contract months gives you CME’s probability distribution of rate levels out to 1 year. This basically ignores interdependence of policy decisions across time and means that the further out you go, the distribution becomes less accurate.
Just keep this image in mind when the CME explanation mentions cumulative binary probabilities:
These videos might help (where in the CME’s case they’re using futures contract prices to determine the probabilities of 25bps-incremented rate hikes, cuts, or pause in a given month that the FOMC meets):
https://www.cmegroup.com/education/request-for-quote.html
“An RFQ is automatically disseminated to the marketplace when a user creates a request for a specific instrument type. This can be a multi-legged spread or a single instrument type. The RFQ alerts interested participants to submit bids and offers on the specified instrument. A user can also submit an RFQ on an existing instrument where there is no market.”
“A Central Limit Order Book (CLOB) is a mechanism financial exchanges use to facilitate trading between buyers and sellers in financial markets. It acts as a central hub where participants can submit their buy and sell orders, which are matched based on specific rules and executed accordingly.
The exchange typically maintains the CLOB, which acts as an intermediary between market participants. When a participant submits an order to the CLOB, it becomes part of the order book, which records all the buy and sell orders at different price levels.”
Search for Issuer Name “FORD MTR CO DEL” and “EXXON MOBIL CORP” here: https://www.finra.org/finra-data/fixed-income/corp-and-agency
And for all you Munger fans that may be inclined to say ‘EBITDA = bullshit earnings’, I’ll just say that I think this heuristic makes in this context because MKTX is net cash on their balance sheet (with very little to no debt and cash & equivalents making up ~50% of book value) and their extremely capital-light business (most D&A coming from accounting for recent M&A) means this is really giving us a pretty close measure against cash from operations without the extreme lumpiness of EV/FCFF that has MKTX has every year due to accounting for changes in “receivables from broker-dealers, clearing organizations and customers” that they started tracking in 2020Q3 and have since had every Q1 and Q3
I had to manually copy the market share data from the press releases on both companies’ websites: https://investor.marketaxess.com/news/default.aspx; https://www.tradeweb.com/newsroom/media-center/news-releases/?Page=1&Date=0&Categories=5&ViewType=list
From Tradeweb’s website: “At the other end of the electronic spectrum, we’re seeing an increase in adoption for much larger and complex trades that may include less liquid bonds. In this case, traders are using our Portfolio Trading protocol which allows them to package multiple bonds into a single basket of buys and sells, negotiate a portfolio level price, and execute the trade in a single electronic transaction. Portfolio trading allows institutional traders to quickly execute upwards of several hundred or thousands of line items – which historically would have taken a day or two of passing spreadsheets back-and-forth to resolve.”
Again, MKTX is a big company with a lot of eyes on. There’s been a lot already written on this problem and others, so I’ll defer to some interesting articles here for further details on MKTX’s issues.
https://www.valueinvestorsclub.com/idea/MARKETAXESS_HOLDINGS_INC/1477010560
https://seekingalpha.com/article/4381523-marketaxess-great-company-not-great-price
https://static1.squarespace.com/static/58f7798829687f53ff30baf8/t/61e88024ea403840e2631912/1642627109448/Upslope+-+2021Q4+Letter.pdf; https://static1.squarespace.com/static/58f7798829687f53ff30baf8/t/625d4cf5eef5817d8a32bae1/1650281718164/Upslope+-+2022Q1+Letter.pdf
https://seekingalpha.com/article/4500979-marketaxess-approaching-a-defensible-valuation


