The Ulysses Pact of Tying Up Cash
Break glass in case of opportunity -- which may be forthcoming
First she said we were to keep clear of the Sirens, who sit and sing most beautifully in a field of flowers; but she said I might hear them myself so long as no one else did. Therefore, take me and bind me to the crosspiece half way up the mast; bind me as I stand upright, with a bond so fast that I cannot possibly break away, and lash the rope’s ends to the mast itself. If I beg and pray you to set me free, then bind me more tightly still. —- “Odysseus” (“The Odyssey”, Homer)
“‘It takes character to sit with all that cash and to do nothing. I didn't get to where I am by going after mediocre opportunities.’”
—- Charlie Munger, “Poor Charlie's Almanack: The Wit and Wisdom of Charles T. Munger”
Since writing the post on Cash as an allocation around the beginning of the year, the market has seen both the 60% and 40% legs of the traditional 60/40-stocks/bonds portfolio sink downward as the Fed raises rates to battle inflation. In this post, I just wanted to go over another useful virtue of cash that has become even more attractive given how things have evolved since writing that article, as well as some other points on the increased attractiveness of cash in relation to the rest of the market given how things have played out.
Table of contents:
Ultrashort bond ETFs as a runaway ramp for frivolous decisions
Current upsides/downsides of cash and ultrashort bonds vs long bonds and equities
Recap
I’d previously written about the virtues of cash as an asset allocation as well as looking into the argument presented by those like Kris Ektrit and Jeff Snider who have been looking at rates from the supply side (of producers and financiers, respectively) in the post here:
I’m going to look at this not the from the POV of “Bond markets are or aren’t buying it“ or “Is QE / bank reserves really ‘money printing‘?“ arguments — that I’m not going to be smart enough to really confirm or reject here anyway — but from the POV of Fat Tony’s “betting against fragility in the longrun”
[…] OK so, what is the possibly fragile thing to bet against here? Low interest rates.
Here we have the US Fed fund rates since 1970 — notice how crazy low our most recent decade of interest rates has been [Now let’s zoom in on the trend in the FFR that started in 2016 which was only smothered back down to zero in response to the COVID19 lock-downs and subsequent economic crash]:
Global supply chains require a carrot and stick to operate Carrot = high interest rates (> 2%, < 10%) Stick = US/NATO military interventionist supply chain security enforcement Low rates == USD yields nothing ==> nobody wants to work for USD (which at this point is zero-yielding monopoly money) == nobody wants to supply US with good and services in exchange for USD ==> people just work to maintain themselves and family w/out selling any excess output (consider the rising popularity of China's Lie Flat movement and Reddit's r\antiwork subreddit or the rising popularity of homesteading and "van life") ==> supply chains break down US military non-interventionism ==> Harder for people to supply + no foreign elite (puppet leaders or otherwise) to force people to output in excess ==> Supply chains break down ==> Congress needs to have the Fed raise rates back to pre-2008 levels + Fed selling its UST (to remove USD from circulation and make USD scarcer) + US/NATO military must re-engage in global interventionism and securing supply chains ==> Those who have saved Cash will be able to live comfortably on a nice big coupon yield (and not have had their 60/40 stock/bond portfolio annihilated on the duration risk leading to those rates). * Also, inflation ==> low supply of stuff low interest rates ==> lower output/hr ==> low supply of stuff ==> inflation ~ low interest rates
While the 30yr-UST ETF, TLT, is now down ~30% YTD (~2x as bad as the S&P500 index, SPX) cash and ultrashort bonds have remained relatively unfazed and now even generate some significant (nominal) yield1.
An allocation of cash and ultrashort bonds also aligns with Zoltan Pozsar’s warning of rising rates in parallel with inflationary pressures; just as capital markets have been drunk on cheap money — though not necessarily “easy” money — perhaps the real economy has been drunk on cheap commodities (with the only cure for inflation being a massive reconfiguration of global supply chains and industrial policy by the western world, which itself will first be inflationary for a long time)?2:
Ultrashort bond ETFs as a runaway ramp for frivolous decisions
All of this focus on building work-arounds and circuit breakers into my everyday life proved to be incredibly helpful —not just in dealing with my ADD but also in becoming a better investor. The truth is, all of us have mental shortcomings, though yours may be dramatically different from mine. With this in mind, I began to realize just how critical it is for investors to structure their environment to counter their mental weaknesses, idiosyncrasies, and irrational tendencies. Following my move to Zurich, I focused tremendous energy on this task of creating the ideal environment in which to invest —one in which I'd be able to act slightly more rationally. The goal isn’t to be smarter. It’s to construct an environment in which my brain isn’t subjected to quite such an extreme barrage of distractions and disturbing forces that can exacerbate my irrationality. For me, this has been a life-changing idea. I hope that I can do it justice here because it’s radically improved my approach to investing, while also bringing me a happier and calmer life. […] I would overhaul my basic habits and investment procedures to work around my irrationality —- Guy Spier, “My Own Version Of Omaha” in The Education Of A Value Investor3
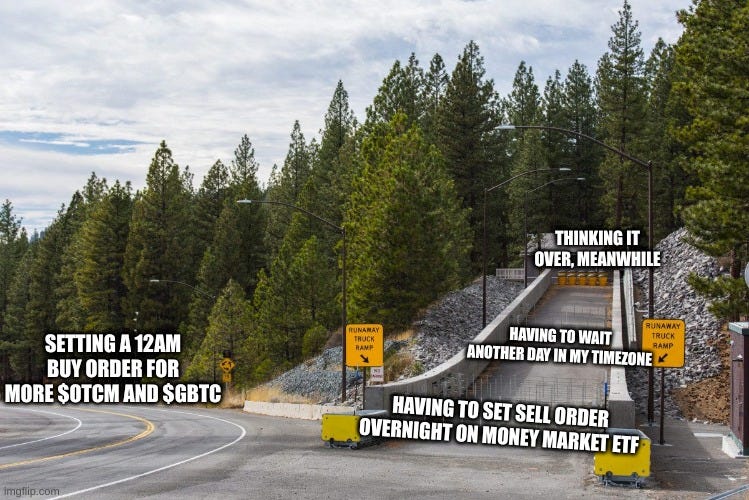
From the video and picture above, you can probably tell how runaway truck ramps work: Regardless of the specific design, they are all built with the purpose of absorbing and dissipating the forward energy of a runaway vehicle in a gradual and safe way — usually a large truck or bus whose brakes have failed while working to descend a long downward gradient.
In “The Odyssey” by the Greek storyteller Homer, the main character Odysseus/Ulysses is warned by the gods that during his journey sailing home he will come across a pair of Sirens who sing enchanting songs to lure men to their island where they keep them hypnotized until they waste away and die. To avoid this, Odysseus has his men stuff their ears with cotton and wax and has the men strap him to the mast of the ship so that he can hear the Siren songs without being able to jump ship and die on the island4. Funnily, I also recall that it was a bit ambiguous whether Odysseus strapped himself to the mast in order to let the crew know when the coast was clear or whether it was so that he could hear the songs for himself without the associated risk — the latter interpretation works even better for my purposes.
One of my “toxic, but I love it traits” in investing is that I have an irrational compulsion towards wanting to invest in things I think are novel or interesting (eg. an interesting technology, a tried-and-true business model being transplanted to a new industry, some oligopoly player in a niche I've never heard of, or some big investor I respect taking over management of a close-ended fund) where I can just vaguely see a path to becoming a growing, high FCF, and high ROIC operation5. This is especially true when the majority of society or investors appears to have strong negative emotions or apathy towards it. In any case, I certainly let these —very arguably, non-fundamental— things factor into my decision-making much more than I probably should.
When I occasionally find these things, for whatever reason, there’s a chance that my brain will latch onto the idea and want to dig for reasons to say “yes” —I'm sure many can relate. Despite everything currently going on in their respective industries, I was recently looking at Investors Title Company, Rumble, and the Brave browser’s Basic Attention (crypto) Token6. This compulsion7 is usually tempered by the fact that I’m actually very lazy and am quick to give up before ever making an impulsive toe-hold position if the main sections of the annual reports start looking too complicated or too boring to try to understand the complicated parts.
One of the ways I’m trying to dissipate this forward momentum when the mental breaks of self-discipline fail is by tying up cash in money market ETFs. This works especially well for me since I live in a timezone where the market is nearly closed before I even have time to eat breakfast, so it means I’d have to schedule the sale of the money market ETF shares on day/night #1, they’ed get sold on day #2 before I wake up, and I’d only be awake to actually reallocate those funds by setting an order to execute on day #4 on day/night #3 — adding time for a cooler head to prevail in the meantime. This whole process works well as a barrier to even initiating step #1 because, again, I’m lazy and if you’re human, you’re more likely than not lazy as well, so this could also work for you. For me, this significantly increases the threshold of conviction required to actually act on an idea (in both buying and selling). It’s an even more so attractive idea given were things in the markets appear to be heading — and the opportunities that could come of it for those with the patience to ignore the siren song tempting investors to get off the boat at a point that could prove, in hindsight, to be well before our final destination.
Current upsides/downsides of cash and ultrashort bonds vs long bonds and equities
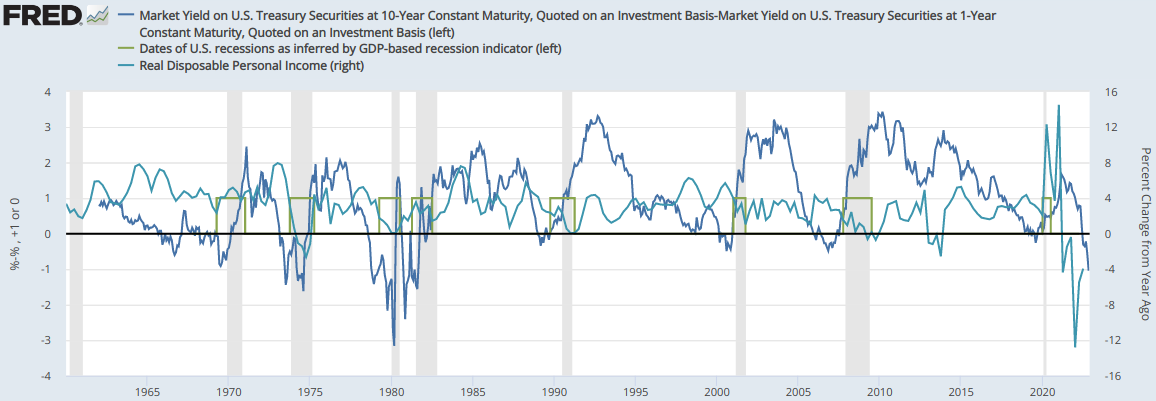
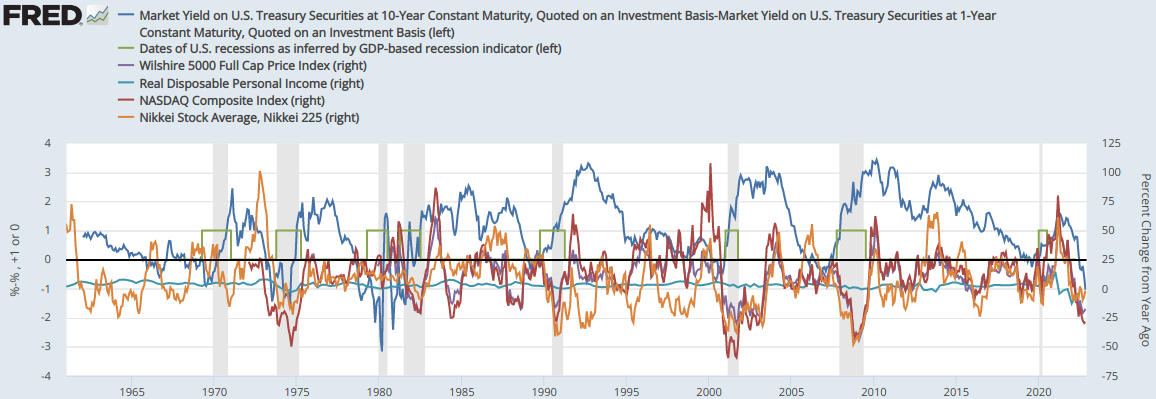
Since writing that previous post on cash, the stock market and long-bonds have fallen 15% and 23%, respectively8. Furthermore, the long-vs-short yield curve has recently inverted (you can generally pick whatever two pairs you want on each end of the spectrum, I just use the 1yr and 10yr here because I’m focusing on ultrashort bonds and the 10yr has the oldest data vs the 20yr and 30yr), which has historically been a good leading indicator of technical recessions to within ~1yr’s time9; it appears that the bond market is crowding into long-term bonds in anticipation of a Fed rate pivot in response to a recession that they expect to be forthcoming. I qualify with "technical" recession here because it's not exactly clear that these really mean anything for the real economy. For example, if you overlay personal disposable income along the curve inversions and FRED-shaded recessions, we see that it's not always the case the personal income levels are negatively affected (eg. 1970, 1980, and 2001).
However, we can see that the stock market does always react negatively in every instance where that data is available; and so for the sake of the electrons and bytes in our brokerage accounts — and the future cashflows it implies — we must plan ahead.
From a commodities POV, an inverted yield curve could also mean less interest in production…
If you consider the minerals as short-term assets, you come to the conclusion that confronted with an inverted yield curve, would prefer to hold minerals in the ground, their most profitable short-term assets. It creates a rise in the price of minerals which comforts them in their behaviour.
Hence, miners would keep a higher proportion of their minerals in the ground where storage is infinite and almost free to them (for a miner, the best short-term asset is minerals in the ground, so selling them in order to buy short-term financial assets is simply not relevant), rather than sell them and invest the proceeds in long-term assets. Because of their self-restraint on output, hence on supply, they generate as the commodity price rises, which is compounded with the increase in their unrealized revenues.
That behaviour need not be conscious but is probably the result of the propagation of arbitrages through the different financial markets, among them the cash and derivative markets on fixed income securities and the cash and futures markets for minerals [eg. leaving minerals in the ground and selling them on a pre-pay basis under some futures contract when the futures curve in in contango]. —- https://seekingalpha.com/article/75034-commodity-conundrum-solved-the-hidden-parameter-in-interest-rates
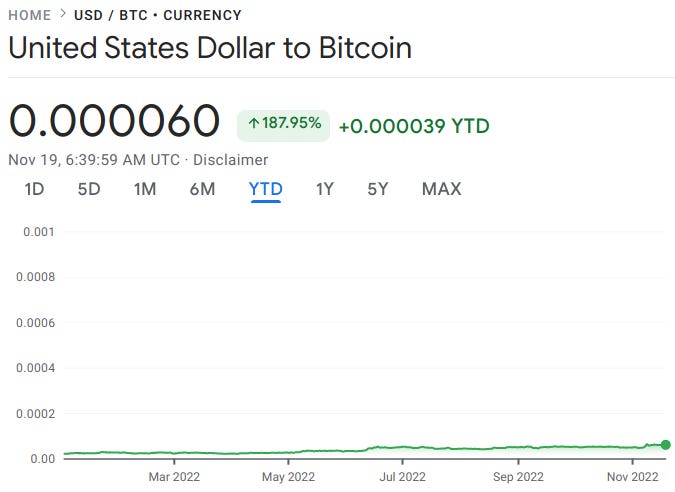
In my 1H2022 portfolio review, I noted that I had significant cash holdings and — while the market price performance of cash and ultrashort bonds have generally been flat YTD — the overall value of the USD vs other currencies as shown via the US Dollar Index (DXY) is now up 11% YTD, a sort of hidden gain for holders of cash; the USD/BTC exchange rate is up ~200% as well.
If there’s going to be a Fed pivot back to zero percent interest rates, cash and ultrashort bonds, ie. those with maturities of 1yr or less, (along with longer-term bonds and the S&P 500 that have thus far been getting killed) will go up. On the other hand, if the Fed really does go full Volcker to hammer inflation (and thus demand) and hikes rates all the way up to 5%, 10%, or beyond, then cash and ultrashort bonds — with their ultra-low duration — are going to get slapped on the wrist and make up for it with low-risk yields not seen since the 1970s (plus be available for reinvesting in the newly crashed stock market10), while the longer-term bonds are going to continue to bleed as they’ve been doing this whole year (along with the rest of the stock market).
Lest you worry about risk of total inflationary currency debasement from holding cash — noting that nominal rates are still below that of inflation — I’ll just say that I’ve personally remained invested in ~50% commodities, ~25% “other stuff”, and ~25% cash + ultrashort bonds, to give you some idea of how I see the probabilities (and the cash position grows by the month as the other allocations continue to successfully throw off cash flows as distributions). Despite, such a broad non-participation in the markets, this has thus far done a fine job of keep my portfolio positive in the low single digits YTD, while the overall bond market and S&P500 have averaged -20% over the same period. This isn’t a recommendation for going all cash, but for going more cash — the average investor may presently be over-allocated into stocks, as we will see in a bit.
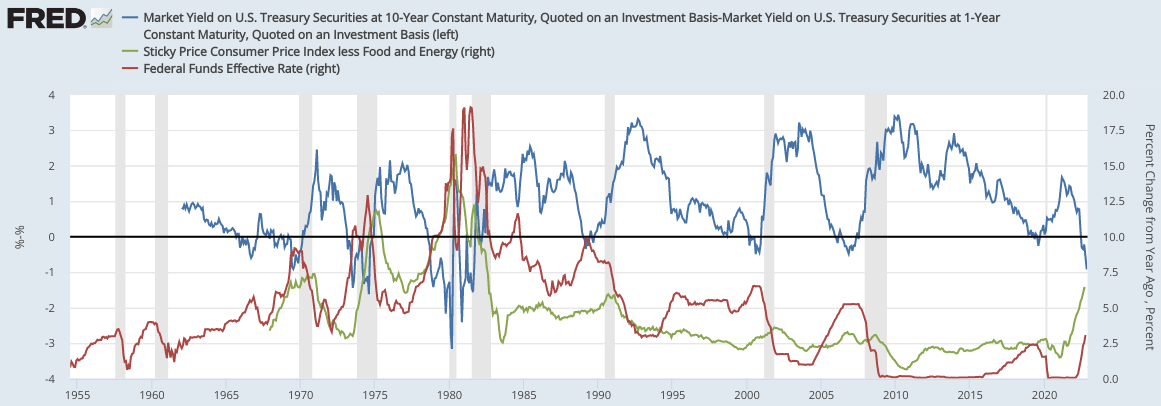
Below you can see that there have been a non-zero number of instances where the curve inverted, there was a recession within a year, and the rate of inflation still rose. Another interesting thing to notice is that after 1980, generally, every leg down in the inflation rate was (had to be?) preceded by a period of higher overnight interest rates. If that pattern holds for the Fed’s fight against inflation this time around, there may yet be significant pain in store for stocks and long bonds.
In light of this, here is a menu of several liquid ultrashort bond funds that I think are interesting across a spectrum of less-than-1yr maturities across which I’ve personally allocated ~20-25% of my portfolio:
(Note that I use SEC yield here (vs TTM yield) because of the shorter look-back period in SEC yield calculations in combination with the way rates have been moving this past year that would make TTM yields look smaller than what they would be if money were placed in the funds right now (and rates held or continued to rise). Also note that many ultrashort bond funds had no distributions through 2021 because FFR was below the fund's expenses and you can see this in their various distribution histories.)
Average maturity = 0.09 yrs
Expense ratio = 0.14%
SEC yield = 3.21%
Average duration = 0.09yr
==> price decline of about 0.18-0.63% for a rate increase from 3% (current Fed Funds Rate) to 5-10%
GBIL:
Average maturity = 0.38 yrs
Expense ratio = 0.14%
SEC yield = 2.78%
Average duration = 0.37yr
==> price decline of about 0.50-1.75% for a rate increase from 3% (current Fed Funds Rate) to 5-10%
SHV:
Average maturity = 0.30 yrs
Expense ratio = 0.15%
SEC yield = 3.57%
Modified(?) duration = 0.29yr
==> price decline of about 0.58-2.03% for a rate increase from 3% (current FFR) to 5-10%
SHV's reported convexity11 is 0.0, so I just assume similar for the rest of the ultrashort bonds listed here, since they don't explicitly show it anywhere.
JPST (0-1yr corporate debt and ABS):
Average maturity = 0.48 yrs
Expense ratio = 0.18%
SEC yield = 3.85%
Average duration = 0.25yr
==> price decline of about 0.50-1.75% for a rate increase from 3% (current FFR) to 5-10%
VUSB:
Average maturity = 0.9 yrs
Expense ratio = 0.10%
SEC yield = 4.57%
Average duration = 0.9yr
==> price decline of about 1.80-6.3% for a rate increase from 3% (current FFR) to 5-10%
Expense ratio = 0.35%TTM dividend yield = 10.52%12One important note is that JEPI is likely not tax-efficient, since distributions from the fund may be taxed as income (ie. the income from the fund selling call options) and dividends from underlying stock holdings are not considered qualified because of the offsetting options positions. I think this is a good review of the fund…UPDATE 20230115: Crossed this one out as IDK about the ELN structure underlying JEPI’s covered call strategy.
Expense ratio = 0%
TTM dividend yield = 15.70%
CME
Expense ratio = 0%
TTM dividend yield = 2.25%
CME’s largest segment is interest rate derivatives, after acquiring CBOT in 2007 (with revenue equally made up of ag + energy). Volumes here should see a lift in 2023 given the vol seen in 2022, especially if the Fed continues to hike rates —so there’s some optionality there. As I write this, CME trades around the same price and EPS valuation as it did in the market crash of 2020, while the ostensive interest rate environment has certainly changed.
* Those last three were added just for a bit of flavor as they’ve both done much less worse than the rest of the bond and stock market during the Fed rate hiking we’ve seen YTD, while also generating significant yields (and I do have a few pps invested in IEP).
* Of course, you could also just buy bonds, proper, through your brokerage account. Eg. continually roll 3-6mo USTs, manually, while waiting for market valuations to come down, so as not to lose the various extra bps in fees on these ETFs.
For context, the Vanguard High Dividend Yield Index ETF (VYM) is down ~9% YTD with a 2.70% yield, while VUSB — the ultrashort bond ETF listed above with the highest duration — is down just 1.30% with a yield of 4.57%. If you allocated equally across all five of the ultrashort bond funds above, you’d have an average yield of 3.60% — 1pps more yield than VYM with a fraction of the duration risk. Also note that, unlike the dividend yield ETF cited here, interest/dividends from US bonds/funds (like those of SHV and GBIL) distributed by ETFs are exempt from state taxes13. So, in the end, I suppose the choice depends on what direction you think the economy is heading in next (wherein you may opt for the upside potential of equities or the equivalent yield, plus downside protection, of ultrashort bonds); perhaps it just depends on your level of “mindfulness”14...

Perhaps you want to take a page out of Seth Klarman’s “Margin Of Safety” and totally forgo trying to predict where rates are going to be, along with anything else relating to macro or other things outside of your control; “By way of example, a top-down investor must be correct on the big picture (e.g., are we entering an unprecedented era of world peace and stability?), correct in drawing conclusions from that (e.g., is German reunification bullish or bearish for German interest rates and the value of the deutsche mark), correct in applying those conclusions to attractive areas of investment (e.g., buy German bonds, buy the stocks of U.S. companies with multinational presence), correct in the specific securities purchased (e.g., buy the ten-year German government bond, buy Coca-Cola), and, finally, be early in buying these securities. The top-down investor thus faces the daunting task of predicting the unpredictable more accurately and faster than thousands of other bright people, all of them trying to do the same thing.” This is totally understandable and I applaud your resolve, but there are just some things that my caveman brain can’t ignore (especially considering Warren Buffett’s statement that “[t]he most important item over time in valuation is obviously interest rates.”)…
Consider this leading indicator of forward 10yr returns by the pseudonymous Jesse Livermore which looks at the estimated, average, domestic US investor allocation into equities to predict the future 10yr returns of the S&P 500 index. When plotted and linearly curve fitted against forward 10yr SPX returns data for for the same period (so we only have data for 10+yrs ago), this indicator scores an r-squared of ~0.801516. To put that in other terms, if you were scoring this indicator as a machine learning model for its ability predict future 10yr returns for the SPX, you could say that the model has an 80% predictive accuracy17. This 0.80 r-squared is quite high on a relative basis as well as “R-squared value[s] [are] expected to be low especially in any field of attempt that is to predict human behavior [which markets certainly are an instance of]. For example, in psychology, typically the R-squared values are lower than 50%. […] Social scientist who [are] usually trying to learn something about the big variation on human behavior will have a hard time to get the r-squared value above 25%.”18.
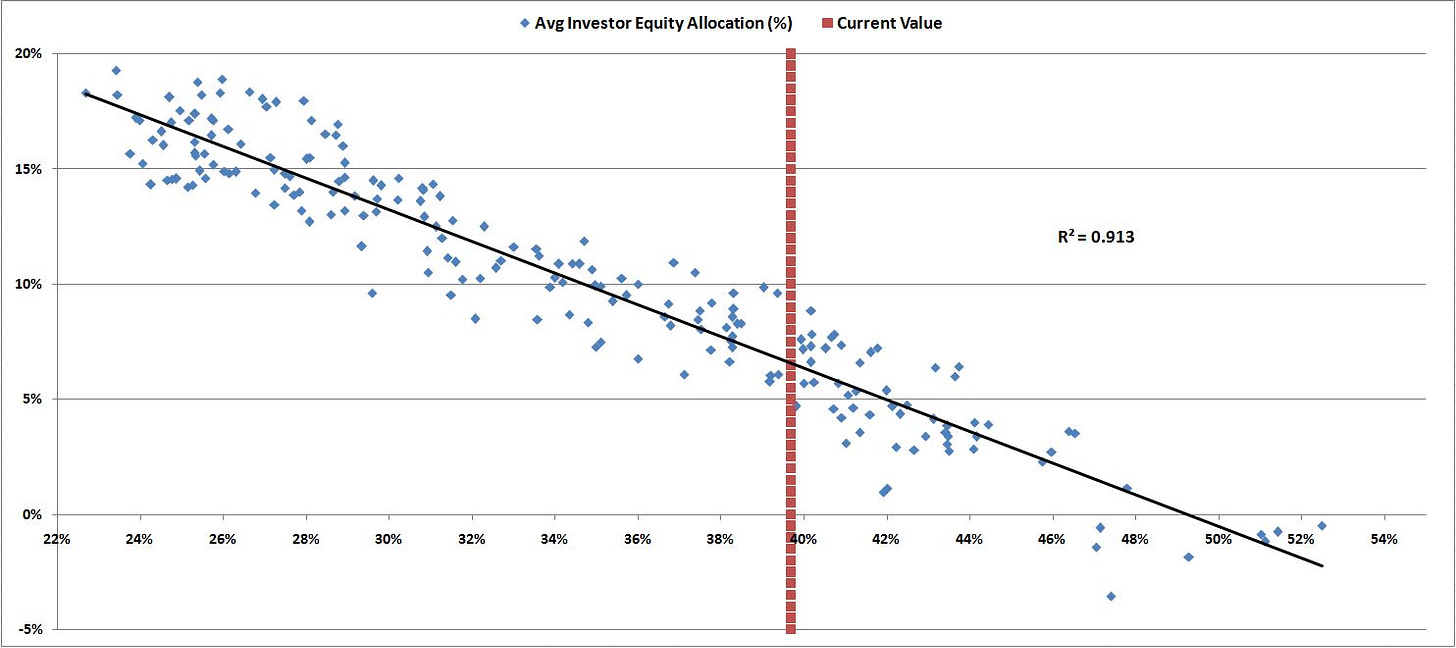
With this linear equation providing a mapping of how investor allocation ratios relate to forward 10yr SPX returns (the Y-axis above), we can use the slope coefficient of this linearly fitted trend line to scale a Y-axis measuring 10yr expected annual SPX returns against the estimated average investor stock allocation in a 1-to-1 way, so that we can use the average estimated investor stock allocation ratio to predict forward 10yr SPX returns nicely in a single chart19.
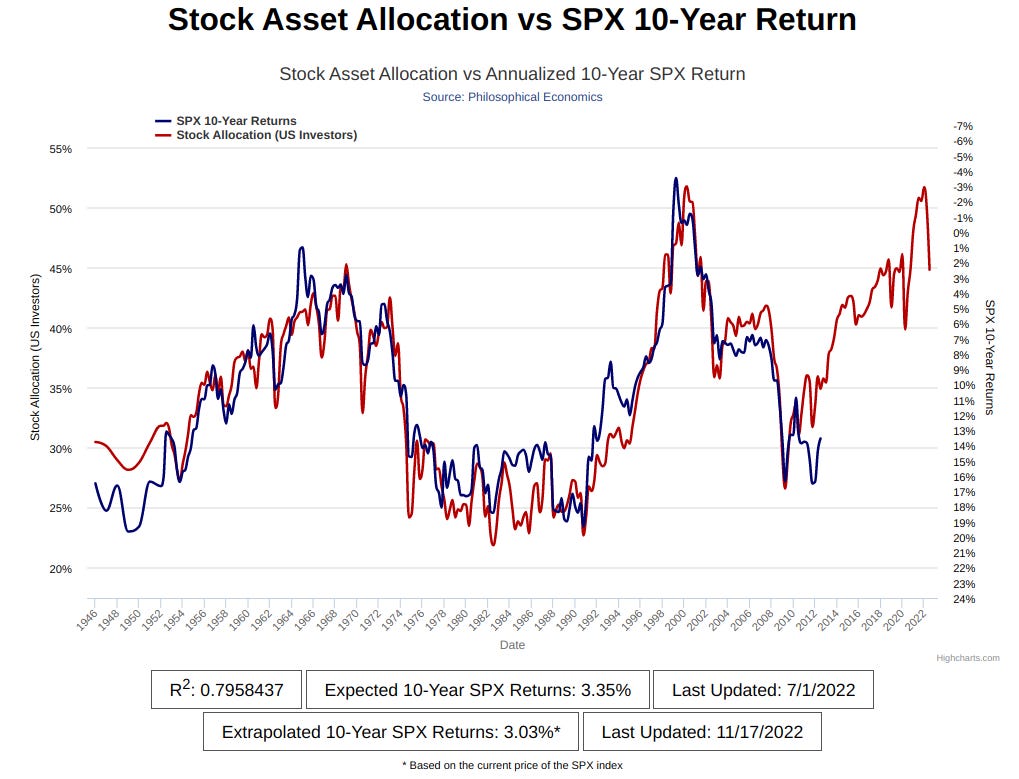
The way to read this chart is that the blue line is backwards-looking, showing what has happened on average over the past 10yrs from that point in time (thus there is a 10yrs lag from present day for the blue line data to be realized), while the red line is forward looking, predicting what will happen (over the next 10yrs) starting from that point in time when we measure it against the right-hand-side axis. (Some further discussion on this indicator can be found here).
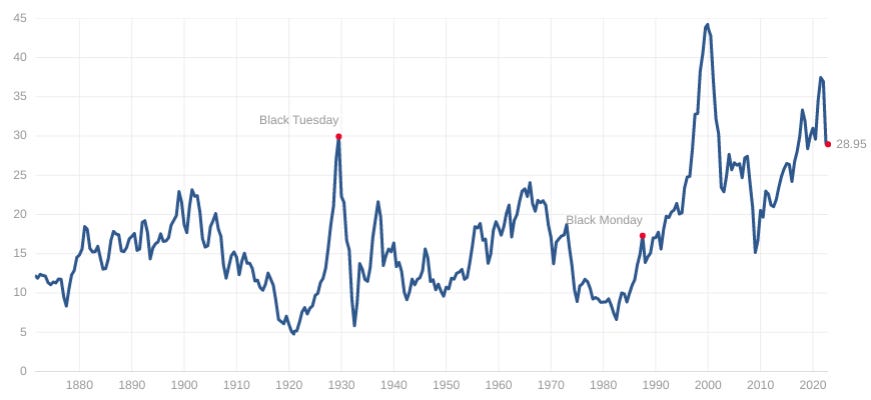
We see from this that the S&P 500’s 10yr expected returns are approximately less than the current yields from ultrashort bonds and with a lot more downside duration risk if rates keep increasing towards 1970s levels. This is similarly reflected in another more popular market valuation indicator, the Schiller PE ratio20:
Notice — aside from the observation that the ratio throughout its history has only ever been higher on Black Tuesday (which kicked off the Great Depression) and during the 2000’s dot-com bubble and that much lower valuations can persist for near decades — that we get an expected earnings yield of 1/29 = 3% at current price levels (with the eye-balled median trending at ~15x P/E or 7% earnings yield). So, if you bought into a “diversified” S&P 500 index, your annual returns over the next 10yrs are expected to be around 2-3%, which is just a bit less than if you just parked your money in the much less volatile ultrashort bond funds right now. Did I mention that the yield curve recently inverted?
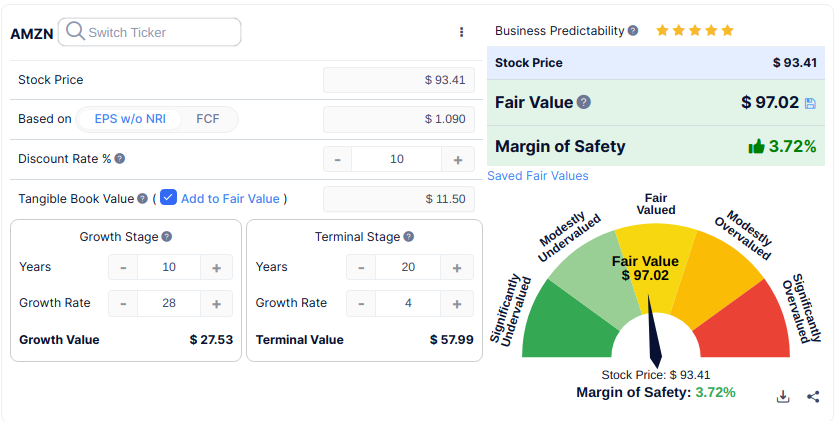
One last bit of more concrete illustration: Amazon is one of the top weightings of the SPX index and one that I also think is very “interesting” as a business, but not necessarily as an investment, presently21. Below is a simple DCF for Amazon where I use a discount rate based on the long-term market returns of 6% + the current 10yr UST yield of ~4%22, a generous terminal stage length and growth rate to account for the strength of their monopoly, and then work backwards by entering whatever net income CAGR that got me to the around the current actual price — interestingly, this ended up being the around the CAGR of EPS w/o NRI from 2010 to 201923 (which I thought was a fine period to use considering how they uniquely benefited from the 2020 lock-downs and the stock has since given up all of its gains since then). From this, we can see that the market has already priced AMZN at a fair value today if we believe that the next decade starting from here will look like the previous — this is perhaps a Lindy24 argument when looking at the last decade of interest rates (not so much when looking at the last five decades or so)25.
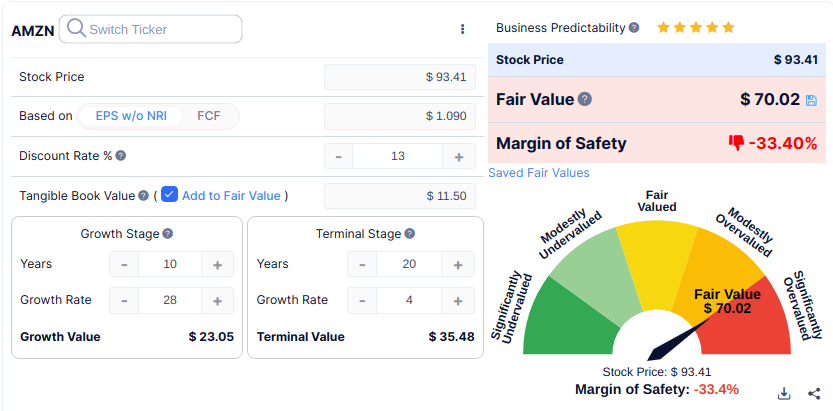
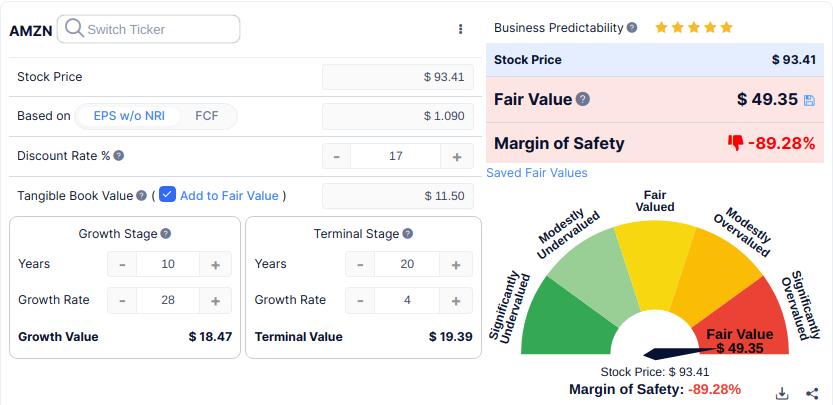
Below, we can see the scenarios in which interest rates are raised to an FFR of 5-10pps/yr (ie. current rates rising uniformly by 3-7pps)26. This can give use a sense of the significant duration risk that remains in the general price level of the stock market, which now more than at any other point in the last 10yrs has a probability of being realized as the Fed attempts to fight inflation.
I’ll end with a reflection by Steve Bregman from a 2018 Horizon Kinetics commentary addressing their large cash position at the time which I think makes some good points in light of the current market environment…
In our case, we don’t mind interim stock price volatility; we’re more concerned with long term returns. But the opportunity set for attractively priced securities is quite narrow, and the systemic risks quite great. One shouldn’t feel compelled to take one’s cash and place it at risk just because you’ve allocated it as available to be invested. In this regard, there are two additional features to portfolio practice we might add.
One is time diversification, which is not much discussed; discussion almost exclusively centers on security diversification. But the long-term return you get is powerfully determined by when you start: at the top of a market, or 6 months later at the bottom? […] There’s value in a measured approach to capital commitment, and with time comes opportunity.
The other element of cash is that its value is far more dynamic and elastic than people give it credit for — in that its purchasing power rises dramatically when other assets decline. Here’s a quick Rorschach test, an inkblot picture of a serious global trade war. What do you see? If you’re fully, optimally invested, as is said, in the various global equity and emerging markets and investment grade and non-investment grade bond funds, it might look like a terrible storm. If you have a meaningful cash reserve, it might look a lot like a candy jar, for heaven knows what goodies might be inside.
Good luck to all.
Note that you’re likely not seeing this in your regular bank savings account, see
While these trends have appeared to play out in accordance with Zoltan Pozsar’s (or the lesser-known but still very interesting Kris Ektrit or Jeff Snider) prediction of rising rates as the deglobalization trend continues apace, the exact reasons/motivations behind the rate increases being still up for debate depending on who you lean towards (as those represent very different POVs on the economy’s destination).
In honor of the original oral tradition of The Odyssey, I’ve recollected this snippet of the story from memory — and I’m pretty sure it’s done well enough, here (in case anyone who already knows the story well notices any inaccuracies).
I’d like to attempt to excuse this behavior with this quote from Soros in a 2008 interview cited in Sebastian Mallaby’s “More Money Than God”…
“If a story is interesting enough, one can probably make money buying it even if further investigation would reveal flaws. Then later, if you discern the flaw, you feel good, because you are ahead of the game. So I used to say, ‘Jump in with both feet; take one out later.”
… of course, Soros was more explicitly focused on trends and trading —I’m not.
I actually don’t think any of these are bad ideas, even after the initial excitement of learning of their existence; the real problem is the way I was thinking about them.
The problem for me is that it really is a compulsion. For example, this was the image I was originally going to use for this post’s thumbnail…
… but I thought that having boobs and butt in the thumbnail image would be too basic and clickbaity — even though I knew it would probably be more eye-catching — so instead used the less vibrantly-colored image with a bunch of odd human-hawk hybrid women. I primarily write for just myself and even I would prefer the thumbnail above, yet didn’t use it — I believe the french call it “the call of the void.”
Just using the 20yr U.S. Agency Indexes Bloomberg Fixed Income Index from here: https://www.wsj.com/market-data/bonds/benchmarks
For more on this, see https://www.investopedia.com/articles/basics/06/invertedyieldcurve.asp
Even Volcker dropped rates once the hikes went into recession territory, see https://www.cato.org/blog/stop-lionizing-paul-volcker-villainizing-arthur-burns
Just to quickly recap: Duration is the 1st derivative of negative percentage point impact on a bond’s price in relation to percentage point movements in interest rates (in this context usually the FFR) — that is, the pps change in a bond’s price as the FFR varies. Convexity is the 2nd derivative, it measures the change in duration as the FFR varies. See https://www.raymondjames.com/wealth-management/advice-products-and-services/investment-solutions/fixed-income/bond-basics/duration-and-convexity#:~:text=A%20bond's%20convexity%20measures%20the,sloped%20or%20%E2%80%9Cconvex%E2%80%9D%20shape.
There are probably ways to calculate an implied equity duration as well, but I won’t get into that just now. More info can be found here:
Just open the prospectus and word search for “exempt” as well as Googling “<Your state> taxes on federal obligations”. For more info, see https://www.fidelity.com/learning-center/investment-products/mutual-funds/tax-implications-bond-funds
You can read the logic behind this indicator here: http://www.philosophicaleconomics.com/2013/12/the-single-greatest-predictor-of-future-stock-market-returns/
Well, kinda (https://www.kdnuggets.com/2020/07/r-squared-predictive-capacity-statistical-adequacy.html); it depends on whether you believe Livermore’s argument about investor allocation driving returns (ie. that using investor stock allocation as a model is well-specified enough (see https://openforecast.org/sba/assumptionsCorrectModel.html))
I assume that’s how they do it in that final chart, the article does not provide details on that.
You can try the same exercise with Apple (which actually has FCFs, unlike Amazon, and is the top weighting in the SPX right now as well as being another company that I think is very “interesting”) here and see a similar characteristic.
https://pages.stern.nyu.edu/~adamodar/pdfiles/eqnotes/dcfrates.pdf, pg.26
In the CAPM, the Cost of Equity = (Riskfree Rate) + (Equity Beta) * (Equity Risk Premium)
(In this case the equity we’re using for the opportunity cost here is of the market as a whole as represented by the S&P 500 rather than a relative beta of the particular stock, so the beta is just 1 and the risk premium is the longterm return of the S&P 500).
(1.15÷0.13)^(1÷(2019−2010))−1 = 0.27
Given the pace of technological change, I may also be being generous with the total projected amount of time that Amazon will exist as a company in the DCF here.
I am aware this isn’t exactly how rates move, https://www.bis.org/publ/work574.pdf


