Portfolio Review 2023063, semi-annual
Is that my portfolio or is that the MSCI Small Cap index? Yes.
YTD returns
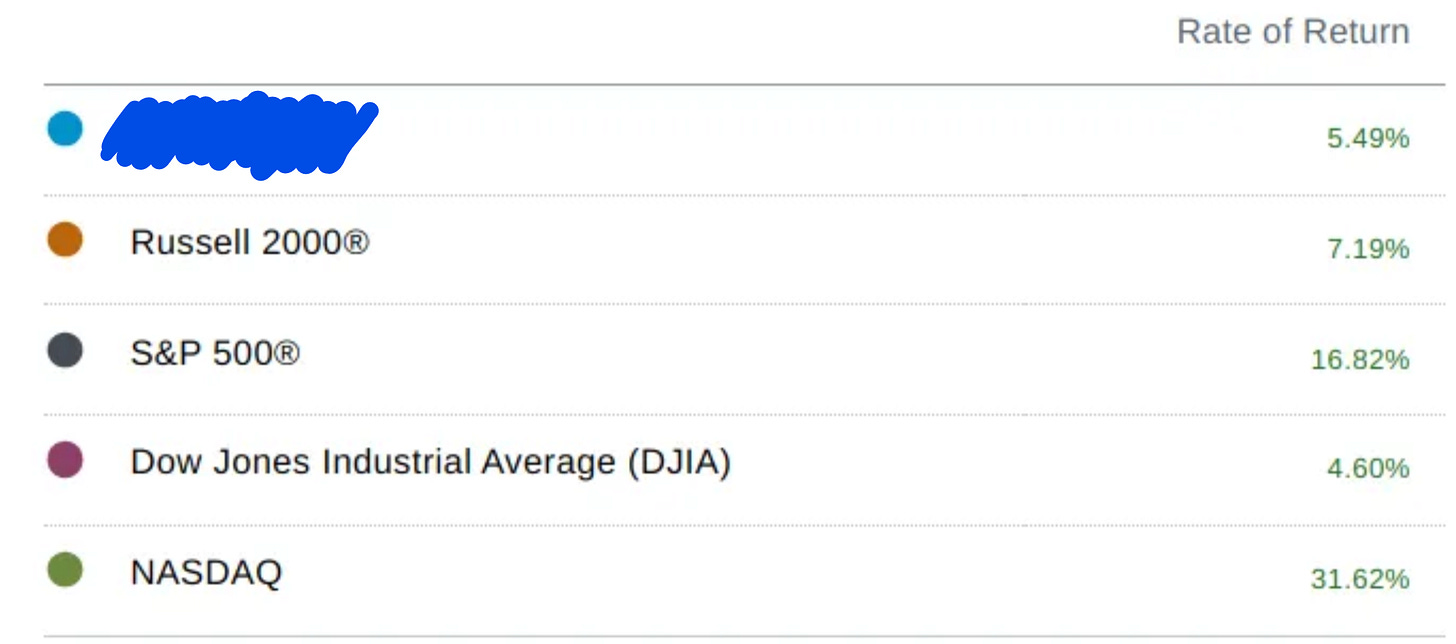
These were the YTD returns on my investments:
This is about in line with the smallcap SPSM ETF and MSCI EAFE Small Cap index (5.89% YTD); though, given the makeup of this portfolio’s asset allocation, I suppose this should not be surprising:
(And I’d also like to point out how I’m handicapping myself vs that index via my large money market allocation; regardless, I did do that willingly, so it’s ultimately on me. I’d also note that this return rate does not account for dividends and interest income that have been retained and not yet re-invested; this would put the YTD performance closer to around 8.6% (just calculating the overall portfolio balance total shareholder return YTD).)
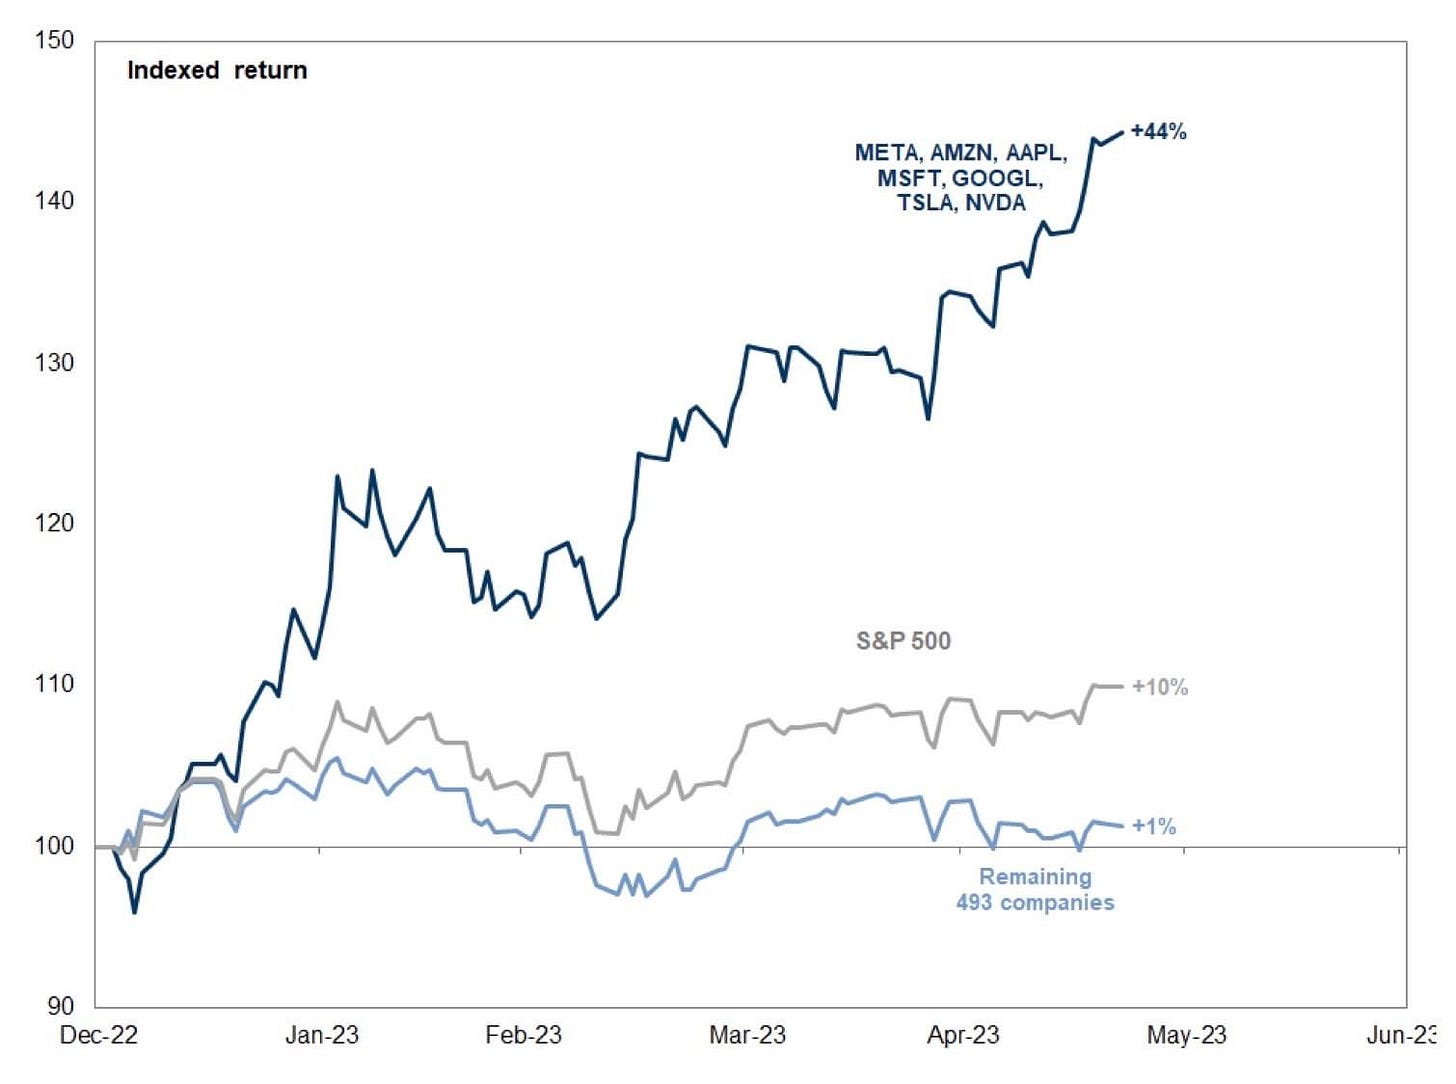
Whether the portfolio YTD returned 5.5% or 8.6%, it’s hard to ignore the fact that it greatly underperformed the broader barometer of the S&P 500 index. To that, I would just point out that the market’s performance thus far appears to be based solely on the performance of a few super-star stocks that are seen as befitting from AI —suddenly brought to wider attention by OpenAI’s ChatGPT LLM— and the FAANG regulars (and now with the addition of Tesla into the S&P 500 index):
(https://twitter.com/Growth_Value_/status/1661998139874713603?s=20)
We can also look at the YTD performance of the S&P 500 ex IT index to get a sense of how certain industry concentrations in the broad index have pulled up the rest of the market:
(https://www.spglobal.com/spdji/en/indices/equity/sp-500-ex-information-technology/#overview)
Note this ex-IT index still includes many ‘new economy’ stocks that are conventionally considered “tech”, as most of the FAANGT is not formally considered to be a part of the IT sector; imagine if these were also removed.
This Barron’s article points out that…
(https://www.barrons.com/articles/apple-tesla-nvidia-powell-fed-a0f06ba3; https://finance.yahoo.com/m/b09d77be-8ca2-3a2e-b408-c43b97083678/apple%2C-tesla%2C-and-nvidia-have.html)
… Meanwhile, these FAANGT, semicondustor, and ‘new economy’ companies —for better of worse— are one of the smallest allocations in my own portfolio, though I did buy small amounts of Amazon and Google (a little more than 1pps each) during the market lows of late 2022.
Note that I don’t really have an opinion on the economy in general. In fact, while the S&P’s performance can mainly be attributed to just a few key stocks,…
(https://www.wsj.com/articles/this-rally-is-all-about-a-few-star-stocksand-some-investors-are-worried-b64382e2; https://archive.li/Qj2HS)
… general market breadth has been trending positively since around the beginning of the year.
(https://www.yardeni.com/pub/breadth.pdf)
.
My real issue with the S&P 500 —despite the fact that it would appear I’d have been better off as a closeted SPY indexer (vs an apparent closeted SPSM indexer)— is that the stars of the index (the FAANGs and now Tesla and Nvidia) have already generally ‘emerged’ and attracted commensurate attention and fund flows. At a simplistic level, their size and valuations don’t seem to leave a lot of room for great upside1; I think suspect there’s a lot of FOMO currently at play here as fund flows have attempted to chase AI-adjacent names in a dramatic way.
********** UPDATE 20230712: On the same day that I published this post, Horizon Kinetics released another paper as a part of their long-running “Under The Hood: What’s In Your Index?” series. Given my large concentration in various HK/Stahl-complex investment vehicles (FRMO and the RENN Fund), it should not be surprising that the paper goes over many of the same ideas I quickly touched on above.
Moreover, the weight of money flows became a kind of limitation (but a limitation with side effects). Indexation’s marginal bid became focused on a narrower and narrower subset of the security universe, on those shares with the institutional-grade trading liquidity to absorb those flows. And, in a self-reinforcing cycle, that narrower subset of securities absorbed an ever-greater proportion of the ever-increasing inflows. This distorted valuations and index security and sector weights in ways that were de-linked from fundamental analysis and valuation. At least, those were some of the questions for debate at the time.
[…] Another is the law-of-large-numbers limitation on the growth prospects of these companies, which is now showing up in revenue and earnings figures. The analytical exercise is to determine whether this slowdown is temporary or of a more permanent nature
[…] At some point, their continued expansion would render them so large that their growth rate should not be dissimilar from—that is, must converge downward toward—the growth rate of the overall economy, whether U.S. or global.
[…] So, the S&P 500 is in something of a bind. If the technology giants—whose index weight is far higher than is represented by the current sector classifications—continue to grow, the S&P 500 will indeed cease to be useful as an index. If the opposite happens, the index will embody a massive concentration of risk because there is no valuation margin of safety in the event of declining profits.
Though I will note again, on that last point re. valuations, that it could be argued that many of these “new economy” giants have artificially high P/E ratios dues to the fact that certain portions of SG&A and R&D expenses that should rightly be capitalized and amortized over time —and thus improve their operating margins and earnings— are forced by GAAP standards to be expense all at once. (See https://distillatecapital.com/wp-content/uploads/2018/10/FAANG_Valuations_Distilled.pdf)
**********
In a big-enough market dip, I’d be interested in Apple (more likely buying indirectly via Berkshire shares) and Amazon (even Tesla at the right price). I guess I’m just a bit skeptical about their continued multiple expansion and growth opportunities going forward vs smaller equities in sectors that presently have a much lesser share of fund flows than the existing S&P 500 superstars that have percolated to the top of the index’s concentrations.2 The index’s current concentration bubble is just not something that I feel comfortable participating in.

In a 2021 paper from the Brandes Institute’s Barry Gillman, he notes that 1) the current S&P Growth index concentration is the highest it’s been since the 2000’s dot-com bubble and 2) the Growth vs Value performance spread is the widest it’s been in 20 years.
The recent growth-stock spike has meant bad news for active managers in growth and value disciplines. Recent manager underperformance may not reflect a lack of skill, but a mathematical circumstance. Growth managers may be benefiting from the wave of growth index outperformance (vs. value), but for them to outperform the growth index itself, they almost need to overweight the mega-cap stocks leading the charge. For managers with a stated process and an eye on risk management, such a tactic may be hard to do without violating internal disciplines.
Value managers may be able to outperform their value index, as the growth mega-stock spike is irrelevant for that comparison. But when benchmarked to the aggregate index (e.g., the S&P 500 Index), any active management gains against the Value Index likely have been overwhelmed by value style [relative, overall] underperformance.
[…]
Investors typically focus on “top ten” as a concentration measure, but now the driver may be the top three or four, leading to “concentration within concentration.” This narrowing of concentration is important, as it has not happened in prior concentration peaks. The current narrowness leaves those indices exposed to significant idiosyncratic risk (i.e., the risk that just one or two of these mega-stocks drops sharply).
I’m fine —for now— eking out a return from outside of the indexation universe that has so far managed to beat the index in turbulent times and return above the 6%/yr watermark that Warren Buffett initially set for his old hedge fund that determined whether he’d be entitled to performance fees for that year
.
And who knows, maybe these businesses will continue to keep winning as the Lindy’ness of their business has already been proven out in these previous 10+ years.
“For whoever has, to him more will be given, and he will have abundance; but whoever does not have, even what he has will be taken away from him.” —- Matthew 13:12
I am reminded of this Buffett quote:
“Earlier I mentioned the financial results that could have been achieved by investing $40 in The Coca-Cola Co. in 1919. 19 In 1938, more than 50 years after the introduction of Coke, and long after the drink was firmly established as an American icon, Fortune did an excellent story on the company. In the second paragraph the writer reported: "Several times every year a weighty and serious investor looks long and with profound respect at Coca-Cola's record, but comes regretfully to the conclusion that he is looking too late. The specters of saturation and competition rise before him."
Yes, competition there was in 1938 and in 1993 as well. But it's worth noting that in 1938 The Coca-Cola Co. sold 207 million cases of soft drinks (if its gallonage then is converted into the 192-ounce cases used for measurement today) and in 1993 it sold about 10.7 billion cases, a 50-fold increase in physical volume from a company that in 1938 was already dominant in its very major industry. Nor was the party over in 1938 for an investor: Though the $40 invested in 1919 in one share had (with dividends reinvested) turned into $3,277 by the end of 1938, a fresh $40 then invested in Coca-Cola stock would have grown to $25,000 by year end 1993.” — The Essays of Warren Buffett
… Or maybe Oaktree’s Howard Marks is right and we are in for a “sea change” in the investing landscape; maybe the Shiller index is due for a correction.
(https://www.longtermtrends.net/sp500-price-earnings-shiller-pe-ratio/)
(https://twitter.com/Halsrethink/status/1671633813573648387?s=20)
Speaking of, in a recent presentation titled “How To Be Fully Invested With Low Risk In This Market”, Howard Marks lays out investors’ options for investing in the low-return world he sees ahead of us. Using a slide from this presentation, I’d say my allocation across these options looks something like this:
(In his presentation, Marks recommends a combination of #2, #3, and #6 —so I’m getting a bit degen here with my small #5 positions).
In Dante’s Inferno, those in hell found guilty of the sin of envy are punished by having their eyes sewn shut3; these sinners are forced to avoid being caught up in “mimetic desire”, as philosopher Rene Girard might say, in the afterlife that they could not resist on Earth. I think that’s a bit similar to the policy I’m trying to impose on myself in a less drastic fashion here by disempowering the influence of the index’s aggregate numbers on my investing decisions emotions by keeping proper perspective on how the S&P’s returns are being created —at the moment, from a very small concentration of (arguably overvalued) stocks all from within very similar business sectors.
Top 10 holdings
My top positions have not changed much since my previous portfolio update aside from some sporadic dollar cost averaging across weeks of increased market pessimism or lack-of-optimism and a few holdings that have naturally grown to a size where they are now worth mentioning.
Portfolio Review 20221222
End of year returns Basically, this year, if you had just kept your money in a savings account (well… maybe more in sub-1yr bonds), you would have had a good chance at beating my portfolio —and the rest of the stock market for that matter; you could say that my portfolio generated an approximately 20% alpha. (Adding un-reinvested dividend income from thi…
Of the portfolio’s equities, the sector allocations can be seen here:
(Note that this only covers the portfolio equity holdings and does not include the ~25% cash and money market holdings.)
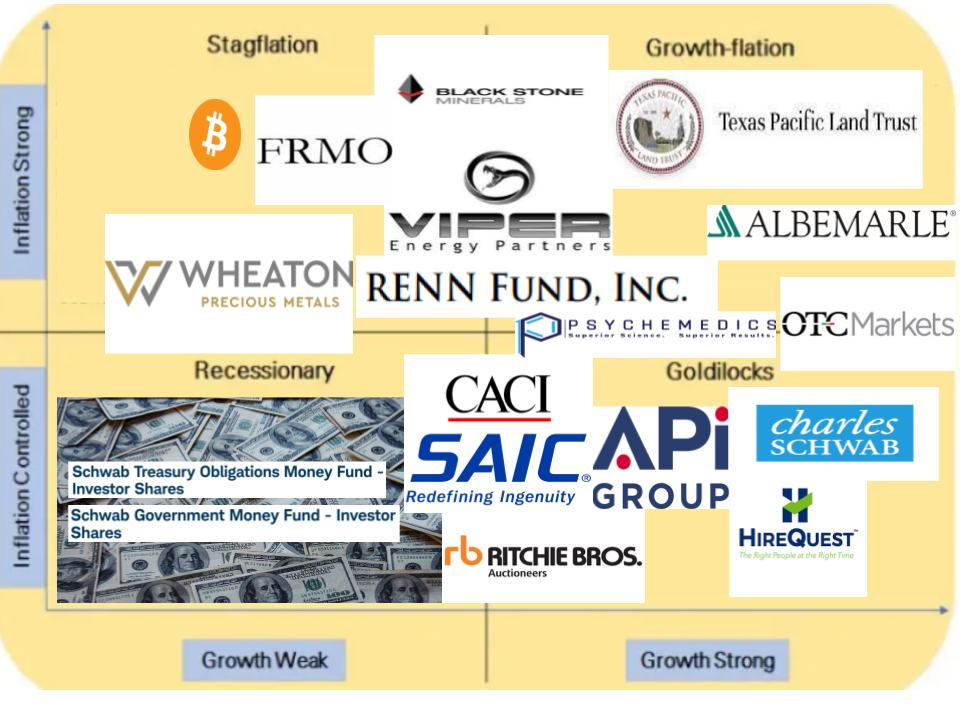
Looking at the portfolio’s outsized sector allocations, I’ll list them here with a few of the major holdings in those buckets (as well as the economic quadrants(s) that I generally think of them as being beneficiaries of):
Energy = BSM, VNOM, EPD, TPL, FRMO, RCG, et al (Stag/Growth-flation quads; 25%)
Industrials = APG, HQI, RBA, CACI, SAIC, IEP, TGH, PMD (Goldilocks quads; 30%)
Materials = ALB, UAN, WPM (Growth-flation; Goldilocks quads; 13%)
Financials = SCHW, OTCM, VIRT (Growth-flation; Goldilocks quads; 15%)
Cash = cash, MMFs, ultra-short bond funds (Stagflation; Recession quads; 25%)
Bitcoin = GBTC (Stagflation; 4%)
Other than BSM, FRMO, RCG, HQI, SCHW, APG, and of course the money market allocation —and, due to the market reaction to recent events, GBTC— none of these individual positions are a much greater than a 3pps allocation in the portfolio. The reason is that I plan to let the portfolio run itself after making the initial decisions to add a position. This idea has to do with the concept of self-organizing criticality, which you can read more about in the link below:
Like Weeds In A Garden: The Zen Of Managing A Portfolio Without Managing A Portfolio
For several years I lived on a steep hillside in a decrepit summer cottage that had what a real estate agent called “charm.” Which meant it was a shack with a view. In keeping with the spirit of the house, I let the yard go “natural,” letting what wanted to be there be there and take care of itself without any help from me. I remember announcing from th…
In aggregate, I think these stocks are generally pretty safe ways to diversify and allocate across these various economic environment possibilities as these companies are —for the most part— capex-light and generally have low debt ratios; the average Debt/Equity and Debt/EBITDA in the portfolio is just a bit less than 1x and the position-size-weighted means and medians are closer to 0x. So, these businesses are not going to get totally killed —and could still do quite adequately— even if the overall macro-winds don’t blow completely in their favor.
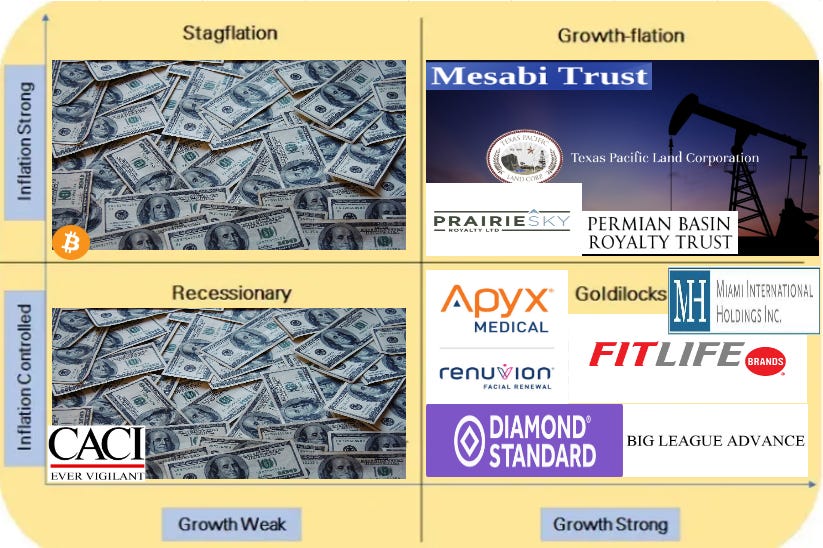
The below graphic gives some rough sense of under what conditions I expect the various businesses or general allocations to do OK:
(Whereas I would say the S&P Global BMI is more geared towards an outsized concentration in the Goldilocks quadrant of the chart above, with much more relative IT and consumer discretionary holdings and no inherent cash-as-an-asset-class allocation; I’d argue that my portfolio is more diversified for the long haul).
Aside from the small, but consistent, re-investment in the various existing positions in the portfolio through sporadic dollar cost averaging over time, I’ve added a few additional positions that I will go over a bit here.
I will re-list some of my main holdings here (iff there are any updates I have any commentary about) in general order of concentration along with going into some newer positions:
BSM and other oil royalties (25%)
Despite the recent selloff in oil equities from their 2022 highs, my cost basis remains quite well below current prices. I won’t go too much into these various names as much has already been written about the merits of holdings a basket of these asset-light, cash flowing, perpetual commodity call options.
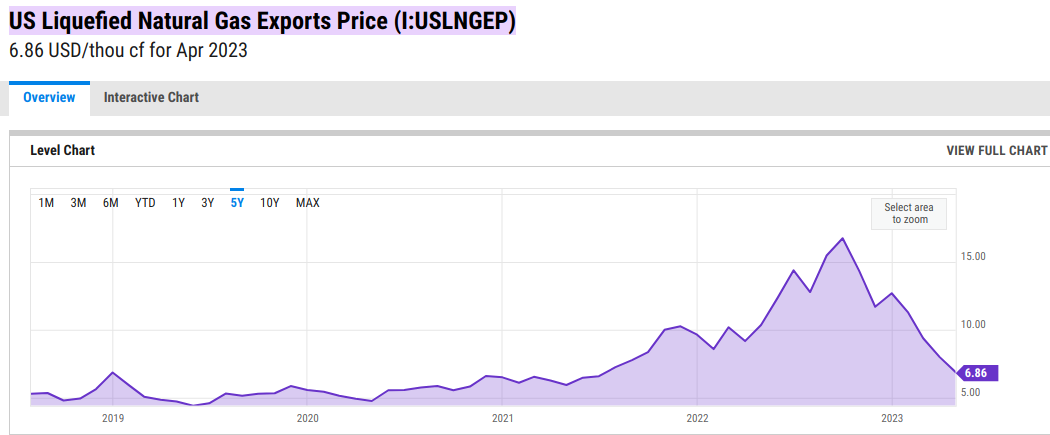
Despite the slump in US LNG prices…
(https://ycharts.com/indicators/us_natural_gas_liquefied_exports_price)
… Warren Buffett also appears to remain bullish on energy commodities:
(https://www.bloomberg.com/news/articles/2023-07-10/berkshire-hathaway-to-expand-us-lng-plant-stake-for-3-3-billion; https://archive.li/hcrLC; https://www.businesswire.com/news/home/20230710023048/en/Berkshire-Hathaway-Energy-Announces-Purchase-of-Additional-Stake-in-Cove-Point-LNG)
I look at it like this, BSM’s dividend —excluding 2020— has been consistent and yielded around 6-8%. Barring any really wild actions by management, or another shale bust of operators, all they need to do is continue to sit there and collect royalty checks on their land; you get constant cash flow while holding a long-duration perpetual call option on future oil prices —that would also be paid out as a distribution. This goes for VNOM, TPL, and WPM (in the realm of gold streaming, which is slightly different, but the same idea applies).
See:
https://www.valueinvestorsclub.com/idea/BLACK_STONE_MINERALS_LP/5078936356
https://www.valueinvestorsclub.com/idea/BLACK_STONE_MINERALS_LP/7040535210
https://finance.yahoo.com/news/gas-stay-decades-fossil-fuel-010000495.html
Money Market Funds (24%)
This cash position has certainly been a drag on returns, but for now I’m fine with collecting the income generated from the highest interest rates in a decade and using it for reinvestment into the portfolio’s various equity holdings.
(https://fred.stlouisfed.org/graph/?g=16SEx)
FRMO: FRMO Corp (7%)
Not much (more) to say about FRMO; I’m still confident in the business and have already written much on it; not much to update here.
($FRMO) FRMO Corp: A uniquely managed OTC jockey-stock hedged for inflation and with incoming catalysts
Table of Contents Quick Pitch Ready for what the indexes aren’t Management Origins Aligned incentives S&B’s stake in FRMO Asset breakdown HK LP Investments TPL Cash Crypto assets MIAX HK stake and revenue participation Upcoming events Risks Conclusion
I will note that FRMO is down 10%, YTD. This is mostly due to FRMO large TPL stake and the current value-destroying lawsuit that the TPL BoD is enacting against Horizon Kinetics and Softvest (who themselves are board members) all for the sake of enabling themselves to dilute shareholders and rule over a larger empire of assets.
The controversy centers around TPL's proposal to expand the number of authorized shares outstanding, which would dilute the holdings of existing shareholders. TPL filed a lawsuit against Horizon Kinetics and Softvest, alleging that they broke the terms of their Stockholder Agreement by refusing to vote in favor of the proposal. Horizon Kinetics and Softvest, on the other hand, assert that they are not required to vote in favor of the proposal and that the item should be considered "non-routine," which would mean brokers can't vote non-votes. The case was heard on April 17, 2023, in Delaware, and the final decision is still pending.4 You can read a lot more about this in the blog here: https://tpltblog.com/
My current view on FRMO’s valuation is laid out here:
RCG: The RENN Fund CEF (5%)
The main macroeconomic view of the fund is “a shift from declining interest rates and minimal reported inflation to static or slightly rising rates and inflation well above trend.” (I think it's also rather impressive to note that this statement was made in mid-2020, before the drastic rate hikes of 2022).
If you don’t agree with that macro view —or don’t want that probability hedged by Murray Stahl— then you wouldn’t want to invest in the fund; however, I can't help but think of the Steve Jobs quote (which also reminds me a lot of Andrew Carnegie's) that “[i]t doesn’t make sense to hire smart people and then tell them what to do; we hire smart people so they can tell us what to do.” This is my intention in having Stahl manage my capital in this heavily discounted, (reasonably) diversified, incentivized, income-generating fund.
With my existing 5% allocation in FRMO, this puts the total amount of portfolio capital in the hands of Murray Stahl and the HK complex at 12%. I’m very fine with this other than the major key-man risk it creates around someone who is a few years beyond that required to be classified as a senior citizen by Medicare standards —though I take some comfort in the fact that Carl Icahn, Howard Marks, and the Berkshire chairmen are at least a decade older than Stahl and still doing their thing.
The shares are quite illiquid, but I’ve had pretty good luck in getting my orders filled at around 20-24% discounts to the fund’s NAV.
($RCG) The RENN Fund: A diversified and discounted permanent-capital nanocap with a lot of optionality, being run for free by smart allocators.
“If I was running $1 million today, or $10 million for that matter, I’d be fully invested. Anyone who says that size does not hurt investment performance is selling. The highest rates of return I’ve ever achieved were in the 1950s. I killed the Dow. You ought to see the numbers. But I was investing peanuts then. It’s a huge structural advantage not to h…
SCHW: Charles Schwab Corp (4%)
I bought this during the height of the panic that surrounded the possibility of a banking crisis near the end of the first quarter of 2023. It’s never too late to invest in a great company (at the right price) and I believed that SCHW was at a good price —one that was baking in a big probability of another GFC that, IMO, wasn’t going to happen; my cost basis is around $55/sh.
Bottom line, there appeared to be —and Mr.Market was certainly acting like it was imminent— another banking crisis; I simply doubted the idea that there was going to be another 2008. Post-GFC regulations lead to me to believe that a 2008 redux was the one scenario that was not going to happen; generals always prepare to fight the last war, after all.
I scooped up SCHW’s dual broker-sweep-to-bank business as well as small positions in banks with long operating histories, survived the 2008 GFC with positive earnings, and high total shareholder return numbers; these were MTB and FFIN.
Schwab is the Costco of financial products and services; they use high quality brokerage and asset management services to attract capital and sweep unused cash from brokerage accounts to their banking arm to earn interest, subsequently re-investing that NII into improving and expanding fin services to attract even more deposits; “scaled economics, shared” as Nick Sleep might say.
(https://content.schwab.com/web/retail/public/about-schwab/schwab_annual_report_2022.pdf)
On the upside view, Schwab, despite what one might think would be butting up against the physics and gravity of further growth, is not yet at the end of it’s value-creation limits and is about to meet an inflection point where FCF starts getting redistributed to shareholders vs big reinvestments —warranting a re-rating by Mr.Market.5
Schwab is after your loose brokerage cash (via cash sweep features) in the same way that Costco is after your membership fees (though unlike brokerage cash, these don’t scale as easily); the products they’re selling you is not where they’re making their money.
Schwab Chariman/CEO was also buying stock in the recent crash (and even more so at a similar price last year):
(https://www.insidearbitrage.com/insider-transactions/insider/0001296479/bettinger-walter-w/ https://www.insidearbitrage.com/symbol-metrics/SCHW/)
These recent purchases total to ~$12MM, which is ~8x his 2021 cash salary and 1x his avg 3yr total compensation. Would you bet an entire year's worth of salary on a business you were not confident in? Do you think that the CEO might have an informational advantage re his own company and industry?
(https://www.sec.gov/Archives/edgar/data/316709/000119312522093320/d246025ddef14a.htm)
SCHW stock was down 36% over the past 12 months; insiders have been buying around these current prices and the stock is trading at a P/E ratio near it’s 2020 lows.
IMO, Mr.Market was panicking and throwing the blue chips out with the bathwater as Credit Suisse and the regional banks like Signature and SVB were facing bank-run / solvency issues. My thought was simply the unoriginal one that, if anything, these panics should drive even more deposits to the larger banks.
On March 17, Michael Burry tweeted this chart and 2 days later banks fell another 15%:
Comparing to Schwab’s ratios at the year ending the 2022 rate hiking:
12291÷(30590+27296) = 21.23% unrealized AFS losses as percent of Common Equity Tier 1 Capital (48% if including HTM securities losses), per the 2022 10K. Schwab would be at the leftmost bottom corner (or center) of this chart —ie. one of the lowest risk banks of all those listed here.
Also note that "Collectively, more than 80% of client cash held at Schwab Bank is insured dollar-for-dollar by the FDIC. According to S&P Global Market Intelligence, that percentage is among the highest of the top 100 U.S. banks. As a comparison, the banks in the news the last few days have between 2% and 20% of their deposits insured.", https://www.aboutschwab.com/perspective-on-recent-industry-events
Where will interest rates go next (potentially hammering or saving existing MTM losses depending on their direction)? I don’t know and, taking a page from the likes of Klarman, Lynch, and Buffett (though I believe that last guy does get secret info of some kind from the Fed and Democrat Party sources), I’m simply not going to concern myself with something that is unpredictable. I’m also not totally sure, and I think many would agree, that the Fed themselves even really know what their going to do from month to month.
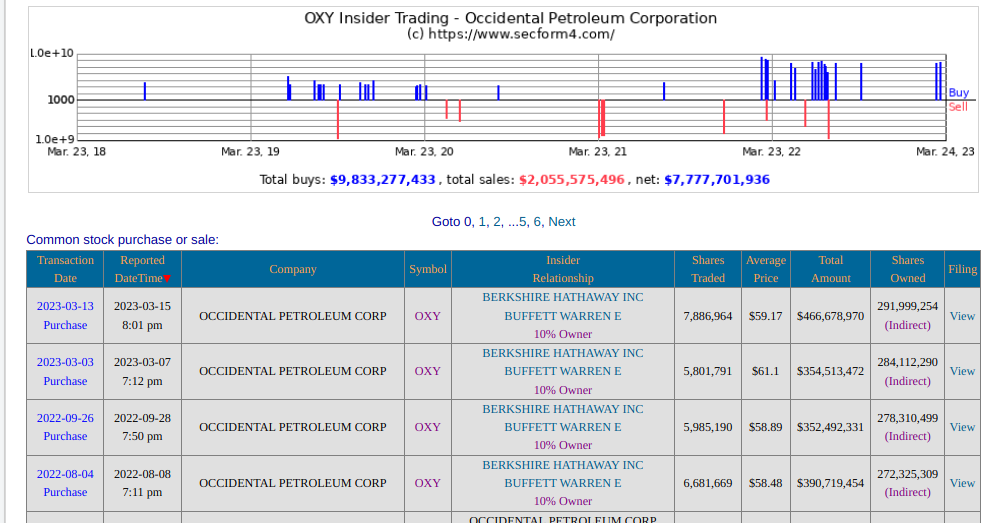
I will say that around this same time, Buffett continued buying shares of OXY which is not something I think you would do if you thought that commodities —being highly linked to interest rates and the general economy— were going to get killed any time soon in a replay of the 2008 GFC.
(https://www.secform4.com/insider-trading/797468.htm)
People think another 2008 banking crisis is going to happen; if anything, I think the thing regulators are most prepared to fight is “the previous war”, so I am betting that a mass banking crisis is not going to happen —not to say that some kind of crisis is not going to happen— and that Schwab is a reasonable way to make that bet as it is relatively lower risk than the other banks, has a differentiated business model, and (so long as they can manage their balance sheet duration risks going forward) provides a holding with positive correlation to rising interest rates that can add some diversity to my other long-commodities bets.
At around $55-60/sh, insiders appear to be optimistic about Schwab’s future and are putting their money where their mouth is I took the chance to get in at prices at or below those that they themselves are paying.
We can look at the fwd 5yr normalized EPS estimates for SCHW and plug in 2022 EPS and a discount rate of (Rf+Re=4%+6%=) 11% (and some non-crazy period lengths, IMO) to plug into a simple DCF model and get a sense of the upside here; this get us to a PT that’s not actually very from the CEO price at which the CEO was buying at in early 2022 —not sure what to make of that.
When does the current price make sense? Well, if we adjust the previous model to only take the estimated EPS CAGR to the 5yr terms that the estimates are actually given for (I extrapolated it out to 8yrs in the other model) and assume rates get hiked another 100bps to get us to an Rf=5%, then we see that SCHW is currently about fairly valued. I don’t think this is too crazy either and I’m fine to “dividend and chill” with that PT for this company as it’s pretty much my cost basis.
Of course, if we get some big recession shock, then all bets are off —and I’ll have a good opportunity to start reallocating my money market capital.
Ultimately, IDK that anyone knows when the next recession or major left-tail is coming and everyone talking / prognosticating about it right now is only making it less likely to actually happen.
(CNN FG Index was around 30-38 when I started making buys)
For a largecap like SCHW, I would normally be concerned about high exposure to systemic risk (given how much fund flows around SCHW are going to be passive, algo/ETF driven) and my belief in “mostly efficient market theory”, in any case. I would think this applies more strongly to such a large and liquid business that has much more eyes on it than some other large holdings I have —I think that the applicability of EMT to a stock (under normal economic condition) increases exponentially with the number of eyes on it, rather than linearly. However the low “greed” rating of the CNN index and the negative sentiment around the banking industry in particular gives me greater confidence in betting on a “behavioral inefficiency/arbitrage” (in this case, “extrapolation bias”) here, as Mauboussin might call it.
OTCM: OTC Markets Group
I look at OTCM as the “ETF” (or at least the primary beneficiary) of all of the investing activity (corporate listing, investor trading, and institutional research) that takes place outside of the major exchanges in the US.
Regarding the EDGAR Online and Blue Sky Data bolt-on acquisitions, I don't really have an opinion on them. Per the (sponsored) Sidoti report, they added a good clip of revenue growth in the market data segment, so there's obviously demand for the products; I like Blue Sky a bit better as I see it as more mission-critical, since more this is more related to compliance requirements for customers1. Both of these acquisitions were done via all cash2and are bolt-ons to OTCM’s market data segment, rather than being any kind of transformational acquisitions, so at the very least they don’t set off any red flags to me (per Mauboussin)3.
IMO, the FINRA approval for OTCM’s FINRA-regulated OTC Link ATS to facilitate trade of digital securities for broker-dealers in somewhat more interesting to me as it has a lot more upside optionality and OTCM basically got it for free by simply executing on their businesses as they have already been doing —a free call option on the expanding adoption and innovation of digital securities (as well as the SEC’s idea of what counts as one).4
An ATS is a regulated trading platform similar to an exchange – there are dozens today, but most operate in the private securities market. OTC Markets provides a trading platform for public securities, including many smaller banks and international firms, as well as Grayscale’s various funds that hold digital assets like Bitcoin (Grayscale Bitcoin Trust) or Ethereum (Grayscale Ethereum Trust). [OTC Markets Deputy General Counsel, Cass] Sanford said that if digital assets are, in fact, securities, they would be considered over-the-counter equity securities. She pointed to Rule 15c2-11 for non-reporting firms, which could be a path for appropriate disclosure. Currently, she believes that a lot of these instruments, when you look at the long tail, they already look like OTC securities.
What’s also interesting about this is that it shows that financial regulators do indeed see a place for digital assets in the US market, rather than being simply interested in creating roadblocks in this space.
OTCM doesn’t really need to reinvest too much in it’s core business to make money and you could maybe make an argument that it does not use it’s capital super efficiently.

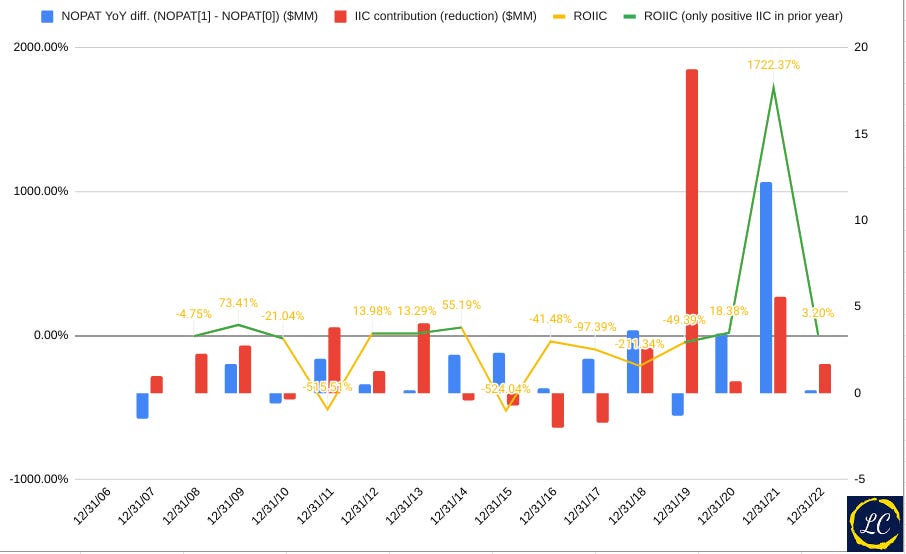
Here I have charted OTCM’s ROIIC where…
ROIIC = (NOPAT[t=1] - NOPAT[t=0]) / (IC[t=0] - IC[t=-1])
NOPAT = Operating income x (1 - effective tax rate)
IC = Equity + Debt + Current and Longterm Deferred Tax Liabilities; I also include the recent Vesay capital lease expenses of OTCM’s HQ property they are sub-leasing from Virtu Financial
We see that often we have a negative ROIIC not because NOPAT declines YoY, but simply because incremental capital is, on net, taken out of the business rather than added to it. In any case, I also highlight the times where IIC is positive to give some view on how NOPAT behaves in cases where management does add capital to the business.
(Note that in the chart, if your looking at NOPAT for a period, the IIC that presumably helped generate that NOPAT is in the period prior, not the IIC that is visually in the same period as the NOPAT bar of interest).
BTW, that big spike in NOPAT in 2021 seems mostly due to large transaction volumes in that year coming out of the 2020 lows, rather than any kind of great leveraging of IIC in the previous year (though perhaps the OTC ECN capex spending in the year prior could be attributed to the helping facilitate those high 2021 volumes —the Virtual Investor Conferences acquisition probably much less so)…
RBA: Ritchie Bros. (formerly IAA)
On November 7, 2022, IAA announced that they would be acquired by Ritchie Bros. Auctioneers Incorporated (NYSE: RBA).
Under the terms of the merger agreement, IAA stockholders will receive $10.00 in cash and 0.5804 shares of Ritchie Bros. common stock for each share of IAA common stock they own. The purchase price of $46.88 per share represents a premium of approximately 19% to the closing share price of IAA common stock on November 4, 2022, and 23% to the 10-day volume-weighted average price, using Ritchie Bros.’ 10-day volume-weighted average price on the NYSE of $63.55. The total purchase price also reflects a transaction multiple of 13.6x IAA’s last twelve-month Adjusted EBITDA2 as of October 2, 2022. Upon completion of the transaction, Ritchie Bros. stockholders will own approximately 59% of the combined company and IAA stockholders will own approximately 41%. —- https://www.iaai.com/Press-Releases/ritchie-bros-to-acquire-iaa-create-a-leading-global-marketplace-for-commercial-assets-vehicles
I don’t plan to sell at the moment. Some observations: 13.6x TTM EBITDA is near the upper range of where IAA traded over the last 12 months — after the initial fall with the overall market in the beginning of the year (+ the big drop after IAA’s earnings report in Q1FY2022).
When I initially wrote about this quick idea in March 28 2022, it traded for $38/sh, so the acquisition price represents a 23% return — which was actually pretty close to the very simple fair value I originally gave of $53/sh in this post.
Ancora Holdings — who wrote an earlier criticism of IAA management that was included in this original post (who now owns 4% of IAA vs the 2% when I originally wrote this post) — opposes the deal and voiced their concerns in the letter here.
Whether the deal goes through or not, I’m content to hold on to my shares for the time being.
As for the decline in used car prices we’ve seen through the year, like I stated in the original article: It’s kinda a non-issue (as used car prices are not really a huge input contributor to their business, but a nice topping on vehicle ARPU at auctions) —despite being the initial reason for me looking at the stock in the first place.
Like I mention elsewhere in the original post, the longer-term idea is that IAA couldn’t get much worse (I mean, they still managed to remain #2 in the oligopoly despite all the problems described in the Ancora letter) and a Copart-like biz is the possible upside if the company had the right management… maybe RBA's management can be that team.
On March 14 2023, IAA made this press release: “IAA, Inc. (NYSE: IAA) (“the Company”) today announced that its stockholders have adopted the previously announced merger agreement providing for the stock and cash acquisition of the Company by Ritchie Bros. Auctioneers Incorporated (NYSE: RBA) (TSX: RBA) (“Ritchie Bros.”) at the Special Meeting of IAA Stockholders held earlier today. […] Under the terms of the merger agreement, IAA stockholders will receive $12.80 per share in cash and 0.5252 common shares of Ritchie Bros. for each share of IAA common stock they own. Upon completion of the transaction, the parties expect that on a fully diluted basis IAA stockholders will own approximately 37.2% of the combined company and Ritchie Bros. shareholders will own approximately 62.8%.”, https://www.businesswire.com/news/home/20230314005855/en/IAA-Announces-Stockholder-Approval-of-Merger-Agreement-with-Ritchie-Bros.
From what I can tell Peter Kamin —whose board presence was one of the things that originally got me interested in the business— has not sold his shares; the most recent filing by Kamin re. IAA was related to the conversion of IAA shares to RBA shares per the acquisition terms:
1. Pursuant to an Agreement and Plan of Merger and Reorganization, dated as of November 7, 2022, as amended by the Amendment to the Agreement and Plan of Merger and Reorganization, dated as of January 22, 2023 (the "Merger Agreement" and the transactions contemplated thereby, the "Merger"), by and among the Issuer, a Delaware corporation, Ritchie Bros. Auctioneers Incorporated, a company organized under the federal laws of Canada ("RBA"), Ritchie Bros. Holdings Inc., a Washington corporation and a direct and indirect wholly owned subsidiary of RBA ("US Holdings"), Impala Merger Sub I, LLC, a Delaware limited liability company and a direct wholly owned subsidiary of US Holdings, and Impala Merger Sub II, LLC, a Delaware limited liability company and a direct wholly owned subsidiary of US Holdings,
2. (Continued from Footnote 1) each outstanding share of the Issuer's common stock held by the Reporting Person immediately prior to the effective time of the Merger automatically and without any required action by the Reporting Person, was converted into the right to receive: (i) 0.5252 of a common share of RBA plus cash in lieu of any fractional RBA common share, and (ii) $12.80 in cash, without interest and less any required withholding taxes (the "Merger Consideration").
3. Includes shares subject to a restricted stock award that were converted at the Effective Time into the right to receive the Merger Consideration.
APG: APi Group
Ultimately, I think of APG like a diversified portfolio / PE “fund” of statutorily-mandated fire and life safety businesses with some very reputable insider owners —though I certainly look askance at some of their compensation— but (future M&A that Becker and the Jarden gang may find in the future) I think the stock is likely trading around fair value at this time, so I see no reason to add to the existing position for now (especially given the lack of a dividend cash-back despite management’s lauding of APG’s asset-light nature).
I wrote more about this here:
($APG) APi Group: Quick Commentary
Intro History Some commentary on the J2 SPAC and the incentives structure A quick note Viking Global Investors Business Life and fire safety Specialty services Strategy Decentralized Rollups/bolt-ons GTM inspection-to-monitoring cross-sell pipeline The Jarden vets
Commentary on some smaller positions
GBTC: Grayscale Bitcoin Trust (4%)
BlackRock has recently applied for a Bitcoin spot ETF to trade in the US; their record for having ETFs approved by the SEC is 575 to 1; this twitter thread had an interesting POV linking BlackRock’s timing to their supposed expectation of a crackdown on large and less-reputable crypto exchanges Binance and Tether, which would allay SEC concerns of manipulation in the crypto marketplace.
This is all interesting as Grayscale is currently in a lawsuit with the SEC that is still ongoing over converting their own Bitcoin trust into a spot ETF and it seems unlikely and inconsistent if BlackRock gets their spot ETF, but Grayscale does not. Furthermore, having competing sport ETFs on the market would likely force Grayscale to lower their existing management fees.
Whether Blackrock is a true believer in Bitcoin’s value or is just intending release these products for more cynical reasons, the underlying point is that this asset manager appears to be anticipating significant fund flows into Bitcoin as an asset class.
Most of my GBTC cost basis is from when BTC was trading at or below the $18-$25K range and the GBTC discount to NAV was closer to 40-50%.
LSXMK: Liberty Media Corp, Series C (1%)
(https://www.libertymedia.com/about/asset-list)
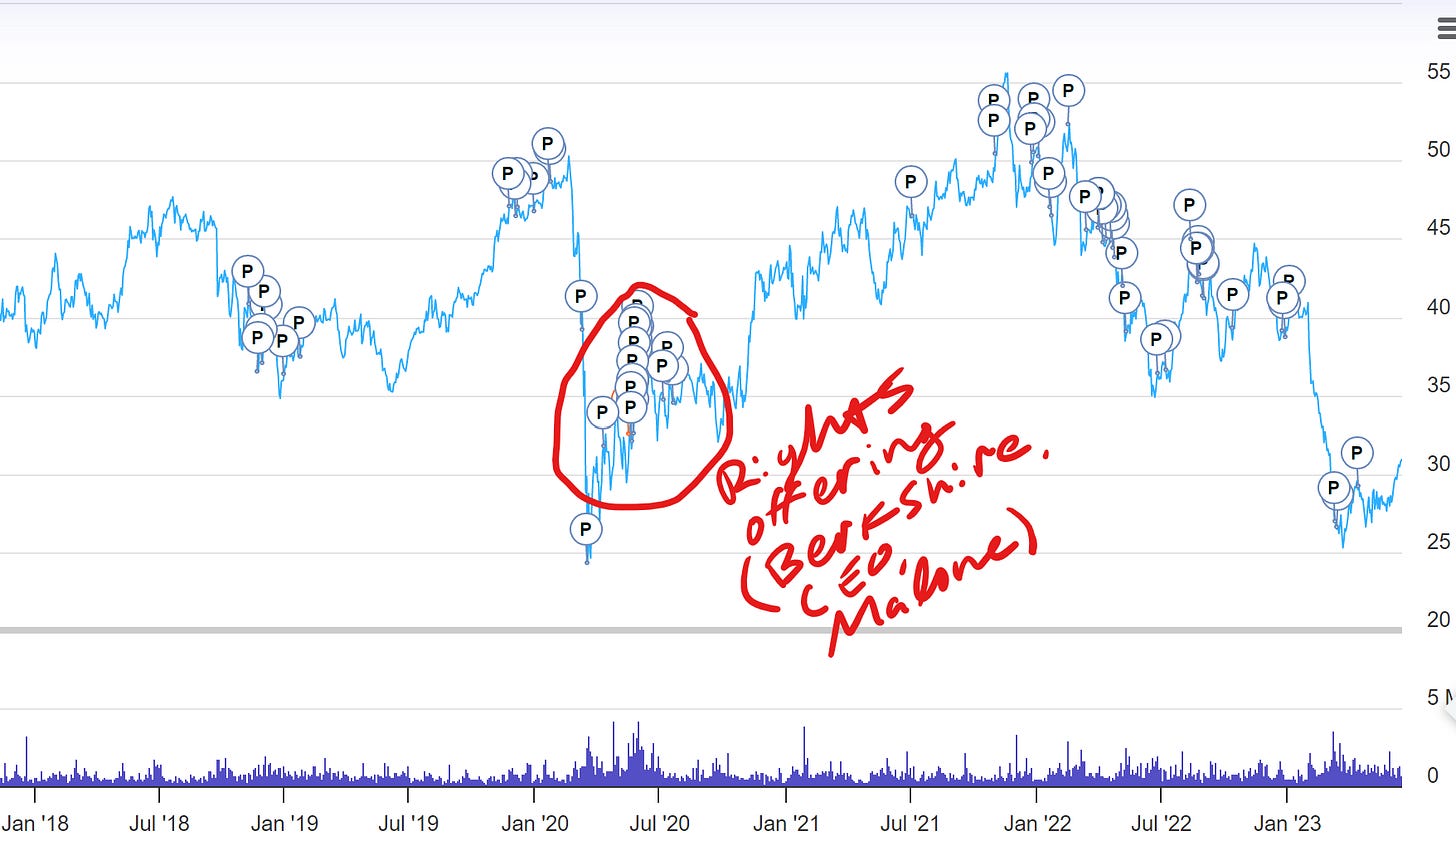
Dipping into the smaller positions that I’ve been DCA’ing into over the past months, I’ll just note that LSXMK, a John Malone tracking stock with an 83% ownership in SIRI and 30% stake in LYV consolidated in it’s financials, currently trades at a 35% discount to NAV6; consolidated EBITDA/EV yield near all time lows of 9.4% vs current effective Fed Funds rate (EFFR) of around 5%.
Prices are near all time lows and approaching those of the 2020 rights offering, at which Warren Buffett, LSXMK’s CEO, and Malone himself were acquiring shares. The actual subscription price was $25.47/sh, but Buffett also bought shares at prices ranging from $35.61 to $36.60 (and his rights were purchased at prices ranging from $10.43 to $11.42).
https://www.sec.gov/Archives/edgar/data/315090/000120919120033068/xslF345X03/doc4.xml
https://www.sec.gov/Archives/edgar/data/1099636/000122520820008646/xslF345X03/doc4.xml
https://www.sec.gov/Archives/edgar/data/937797/000122520820008491/xslF345X03/doc4.xml
https://www.valueinvestorsclub.com/idea/LIBERTY_MEDIA_SIRIUSXM_GROUP/3190023789
I will note that Andrew Walker of YABV has been a long-time Malone fan and has written recently on how Malone has kinda fallen off his game… see this then this then this then this.
But let me propose an alternative thesis here: John Malone was one of the greatest capital allocators / businessmen of all time, but he has done a terrible job in choosing successors. All of his successors sound smart and they know how to talk about creating long term wealth…. but they don’t know how to make money (well, they don’t know how to make money for shareholders; they’ve done just fine making money for themselves with their enormous pay packages!), and Malone’s too rich and too old to admit his mistake and fire his friends / successors, plus he’s maybe a little stuck in the legacy media world and doesn’t see the ball as clearly on how media is evolving. That’s a dangerous combination, and it leaves shareholders really out in the lurch. […] This isn’t the Liberty of old; Malone has either lost several steps or just isn't as involved with Liberty (likely some combination of the two), and his successors are absolutely as skilled in destroying shareholder value as peak Malone was at creating it. And the successors are getting multi-generational wealth while they’re at it.
In the post, he makes the case that Liberty is out of touch with its shareholders due to several factors: Liberty's stocks have underperformed the market over the past few years, with many of them trading at large discounts to fair value. They continue to get caught in apparent value traps, they seem to consistently buy high and sell low, and on a related note Liberty is constantly bungling its capital structure (eg. the LSXM rights offering was done near the COVID lows and only for the purpose of bailing out FWONA); they continue to make questionable capital allocation decisions…
How about last year’s deal to swap Berkshire’s SIRI shares into LSXMK? That was an absolute travesty of capital allocation; LSXMK traded for a massive discount to NAV (which consists largely of SIRI), but they swapped their shares for Berkshire’s full priced SIRI shares. At the time, I thought they would only do that if they had an immediate reason to do so…. here we are one year later and it looks like LSXMK decided to issue stock at a discount for no real reason except to speed up their tax consolidation (something that would have happened this year anyway!).
… and creating financial structures that are difficult to understand. The company's compensation packages are seen as excessive and eating into the underlying value of the company. Walker hopes that Liberty will announce a series of deals that unlock and create value, but is skeptical given the company's track record.
You can read more on this in the post itself.
At the end of the day, I’m OK with putting a small pps allocation in this non-dividend paying, NCAV, tracker stock and letting it ride.
BN: Brookfield Corporation (2.5%)
BN cashflows: https://bn.brookfield.com/sites/brookfield-bn/files/2023-05/bn-corporate-profile-may-2023.pdf, https://bam.brookfield.com/sites/brookfield-bam/files/BAM-IR-Master/Supplemental-Information/2023/2023%20-%20Q1%20Supplemental_BAM%20_Final.pdf,
75% of BAM = mgmt fees (fee bearing capital x mgmt rates) + carried interest (carry eligible capital x performance fee rates) + capital gains investing alongside funds
Operating businesses = Renewables (50% ownership BEP) + Infrascructure (30% ownership BIP) + PE (65% ownership BBU) + RE (100% ownership BPG)
(BNRE) Reinsurance = Life, Pension, and Property insurance premiums (earned premiums — (incurred losses + expenses))
On Brookfield Corporation (since I did include it in the earlier graphic), I am current averaging into the position in my secondary portfolio. The beating dished out on long-duration in 2022 by rate hikes (now trading near the same P/BV at the lowest point of the 2020 crash), tight insider ownership (relative to the large size of the company), and CEO Bruce Flatt’s TSR for shareholders over the past few decades makes BN attractive.
However, the complex structure, their weird inner circle Illuminati controlling group, odd dealings (eg. what’s with the Kushner thing (not that I care one way or another re. Trump or his family)?) and general opaqueness (I couldn’t find any good info on breakdown of beneficial ownership or organizational structure in their annual reports) I think warrant wanting to get a pretty good discount on FV or a less-risked position size.
To unpack the Canadian group’s accounts is to discover not so much a company as a giant, triangular jigsaw board that spreads across the world and covers assets worth $500bn. The pieces are hundreds of corporate entities, all locked together by elaborate contracts, which give 40 people at the top the right to rule huge sections of the puzzle almost as if it were their own.
Those insiders wield such power that the companies below them could face risks similar to those of “pyramid control companies”, according to a draft investor disclosure that Brookfield filed with the Securities and Exchange Commission in 2013. (The final version warned instead of risks “associated with a separation of economic interest from control”.) —- https://archive.is/CG10g
(https://www.ft.com/content/595a77d0-3867-11ea-a6d3-9a26f8c3cba4; https://archive.is/CG10g; this article was post-BAM-spinoff and I’ve not been able to find more info on their current org structure)
I’m comfortable limiting this starting position to DCA’ing up to 2-3pps and letting it rise or fall to the level of concentration it (or Mr.Market believes it) deserves from there in the fullness of time while collecting the dividend; I admit these issues would really make me look askance at the position if it approached 7pps in however many years. It should be noted that Flatt has been running Brookfield for nearly 20 years now without any large incidents —though I’d note that Enron also lasted for nearly 20 years before the house of cards would collapse in the recession of 2000.
Why not just go with MKL and BRK and be done with it in order to invest along side some investing legends without the headache of the structural opaqueness? For me, it’s the dividend (I’ve explained a bit why I prefer a dividends over buybacks as a return-of-capital mechanism, here); I’ve already got a comfortable allocation of distributionless, ‘invest alongside intelligent allocators managing a diversified vehicle’ positions via my FRMO position (where I’m fine letting Stahl make the DRIP decisions for the time being) —and a bit of LSXMK.
You can see an interesting investment case for BN from HK’s INFL ETF manager, James Davolos, here (note that his SOP valuation of $70/sh was in April 2022 when FFR was just 0.33% vs the 5% it sits around today) —though none of this commentary was actually what made me initially decide to invest in BN.
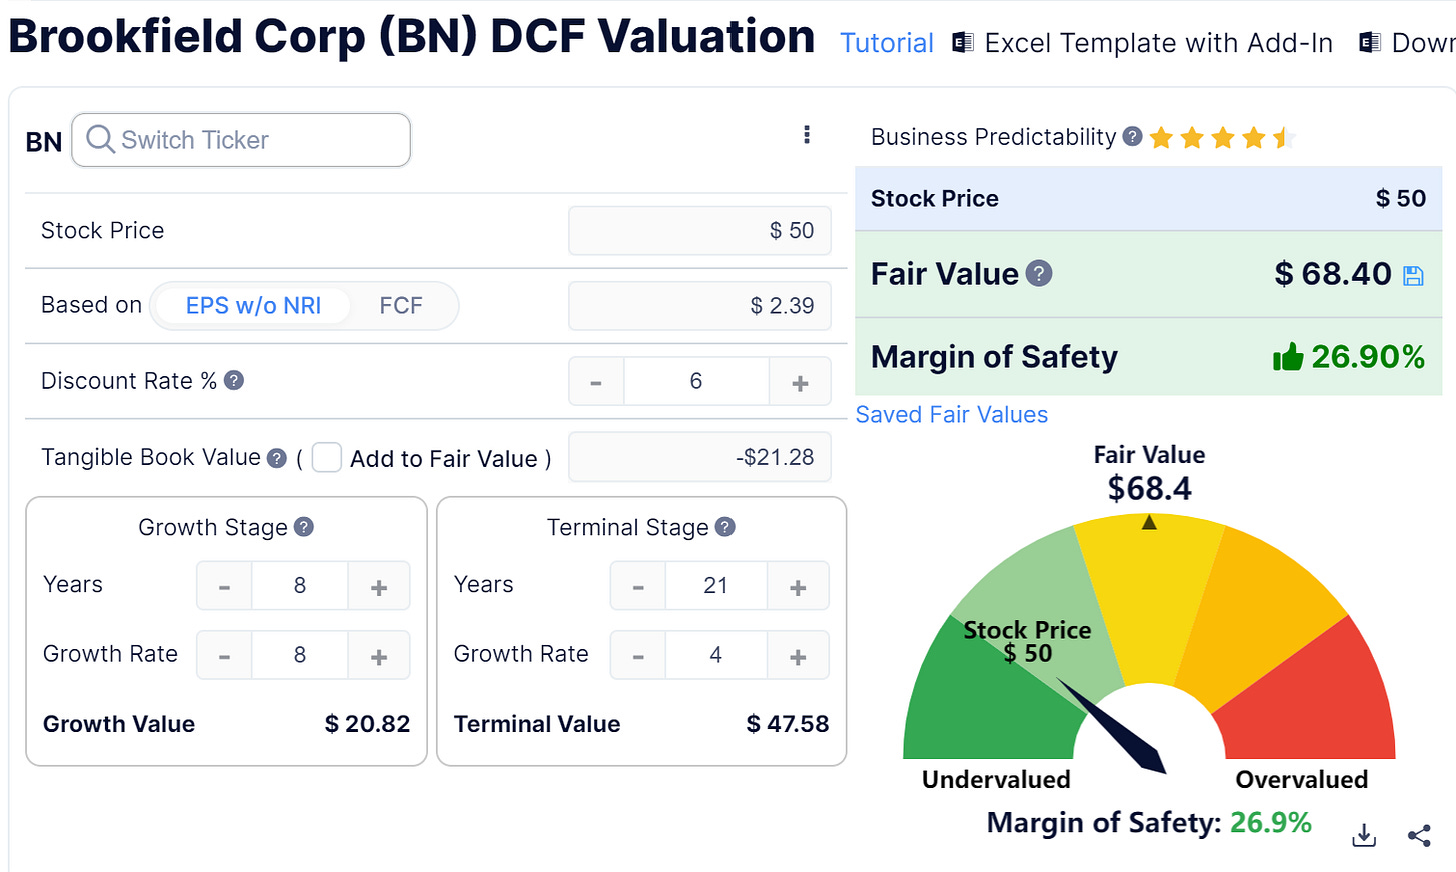
From a simplistic POV, I’d note that the 2021 EPS for BN was $2.39/sh and effective Fed Funds rate (EFFR) was around 0.33%, so we can back out of a simple DCF to see what kind of high-level expectations were baked into the BN share price at the time of that interview with Davolos:
I had to come up with the period lengths myself, but I think they are reasonable (I chose them based on the closest Fibonacci numbers to 10 and 20). In any case, we see we can get to Davolos’ $70/sh PT with a 8% growth rate (which was not too crazy given that BN’s normalized EPS CAGR from 2002 to 2021 was 15.6%) and a discount rate of Re+Rf = 6pps + 0pps, so I’d say his PT at the time was reasonable.
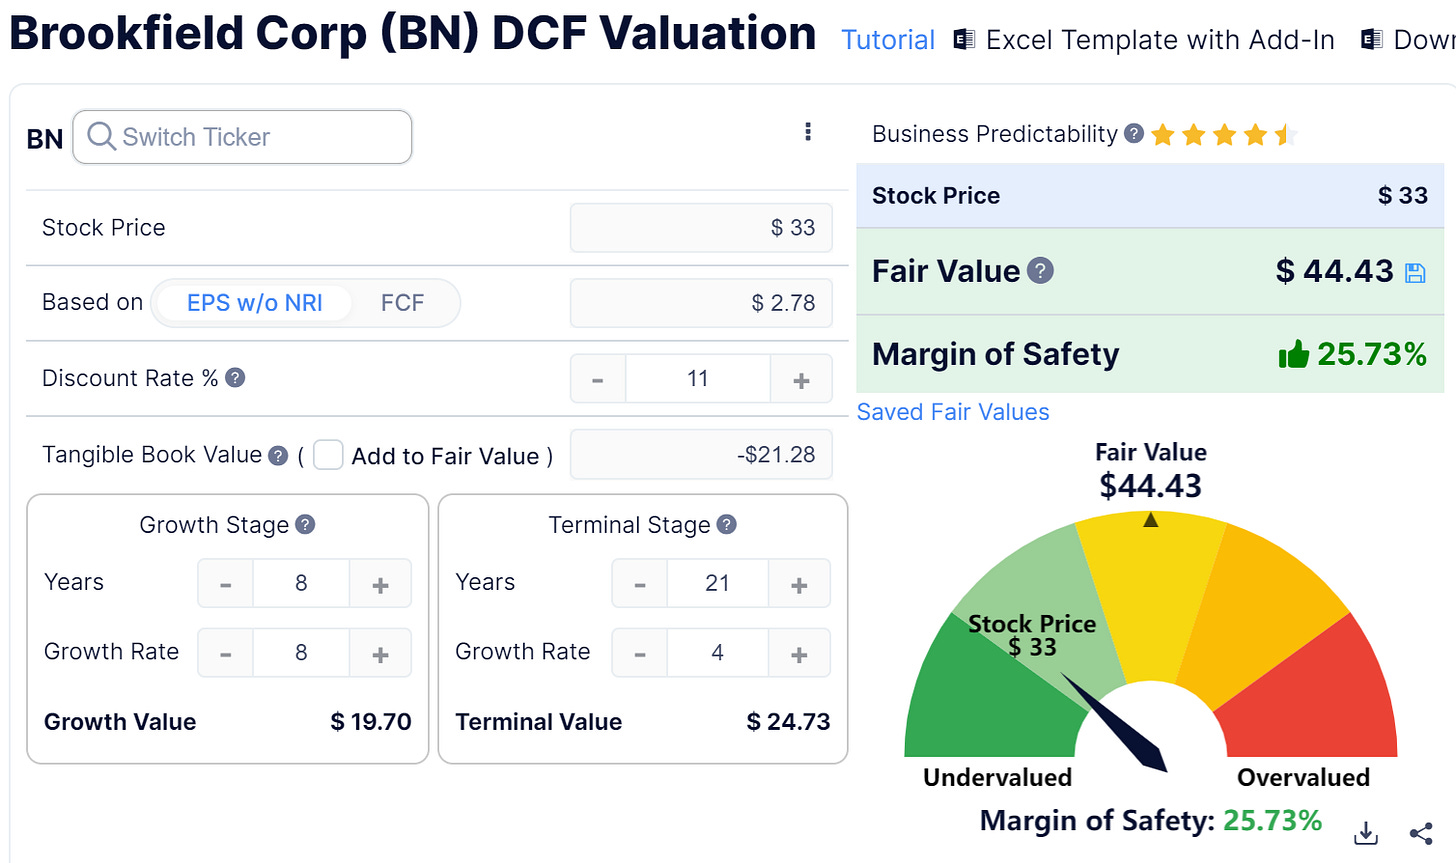
Now that the effective Fed Funds rate (EFFR) is closer to 5%, that discount rate would be closer to 11%. I keep the same implied growth rate from the previous DCF and, noting that 2023 normalized EPS estimates are around $3/sh (so the current price would have BN trading at a 11x NTM P/E or a 9% NTM earnings yield (implying a 4% equity risk premium on top of current EFFR); looking at BN like a well-managed, long-duration, alternative asset ETF, I’d like a more traditional 6% equity risk rate on this for a PT of ($3/sh/0.10=)$30/sh), I set a base EPS of (3/1.08=) $2.78/sh to start the DCF earnings growth off of (so the 2023 year end EPS is the estimated $3/sh) and use that growth rate going forward for the remainder of the growth phase of the DCF; we get a PT of…
… but we will see; if BN is able to meet earnings estimates for 2023, I’d add that to my Bayesian calculus here and be that much more confident in this approximate FV and that they’ll continue to meet expectations going forward even in this environment of elevated and more volatile interest rates.
In any case, we can see that another interpretation of the expectations baked into the current price would require a normalized EPS CAGR of around 18% over the next 8 years. Note that 18% CAGR is the avg normalized EPS estimate for BN over the next 5 years, so relative to these expectations, which appear to have been baked into the price, BN would seem to be trading around fair value at current prices.
I don’t think that these expectations might actually be too crazy either.
On the subject of interest rates, I’d just note that while effective Fed Funds rate (EFFR) was zero-bound in the wake of the GFC (until 2016 wherein they briefly rose to ~2%), BN’s 2010-2019 normalized EPS CAGR was 6% for that period.
As I write this, EFFR is around 5%. BN’s 2003-2007 period, which, aside from being the year after the acclaimed Bruce Flatt’s appointment as CEO, saw EFFR rise to from 2% up to 5% (very similar to where they are today), had an EPS CAGR of 20% —of course, BN also had the benefit of being a relatively smaller business in the beginning of Flatt’s tenure. So again, I’m content to go with a ‘we’ll see’ approach on my BN position.
https://ffj-online.org/2013/03/11/paper-world-of-brookfield-asset-management/
https://www.gurufocus.com/news/212942/is-it-fair-to-attack-brookfield
With this new BN position, it gets harder and harder to justify not simply putting my money in the Horizon Kinetics Paradigm Fund (though they’ve allocated a lot more into the Liberty/Malone complex than I’d be comfortable with, around 5% of the fund’s AUM) or the RENN Fund… maybe if the CEF’s NAV discount really gets crazy in the supposed recession Druckenmiller continues warning about.
Until then, I’ll continue waiting for Godot and making continual small moves to DCA and DRIP into my favored positions while letting cash compound on the sidelines at the new short-term rates that have been unseen in the market for around a decade —and just 2pps below the stock market’s historical 6% long-term rate of return.
Though, this was an interesting article from a few years ago which suggests that GAAP accounting is actually hiding the reasonable valuations of most of these superstars. It’s essentially making the same argument as Michael Mauboussin has long made, along the line that a lot of Income Statement expenses like R&D and large portions of SG&A should rightly be capitalized and amortized on the Balance Sheet, instead.
https://distillatecapital.com/wp-content/uploads/2018/10/FAANG_Valuations_Distilled.pdf
This is an interesting article adjacent to the topic from 2011: https://www.forbes.com/sites/greatspeculations/2011/11/30/how-the-correlation-bubble-hurts-us-all/?sh=3b68b1455bd6
LSXMK has an 83% ownership in SIRI, 30% stake in LYV consolidated in it’s financials; 326.55MM shares outstanding per the 2022 10K.
83% of SIRI marketcap = $17.83bn x 0.83 = $14.798bn
30% of LYV marketcap = $21.16bn x 0.30 = $6.348bn
Combined SIRI and LYV stake = ($14.798bn + $6.348bn)/326.55MM = $64.76/sh
Corporate-level debt = $4.1bn/326.55MM = $12.56/sh
(See “A substantial portion of our consolidated debt is held above the operating subsidiary level, and we could be unable in the future to obtain cash in amounts sufficient to service that debt and our other financial obligations.” per 2022 10K)
LSXMK share price = $33.43/sh
==> $33.43 / ($64.76 - $12.56) - 1 = 35% discount to NAV


