


Portfolio review 2024, annual

********** UPDATE 20241231: Updated portfolio performance charts to include the final days of 2024. **********
Performance
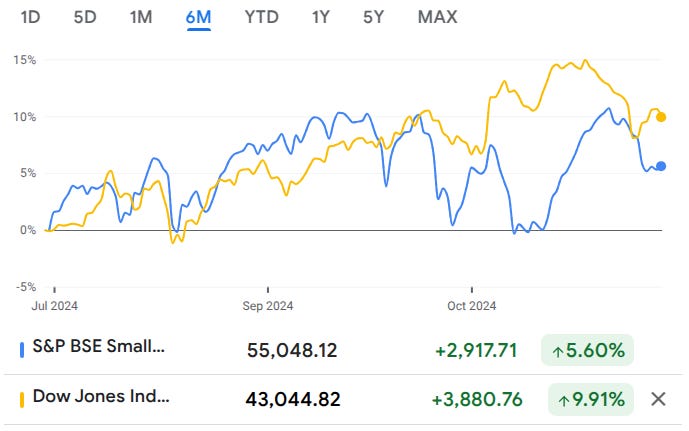
Compared to the actual returns of the S&P 500, midcap, smallcap, and Vanguard total market (which is the better one to use IMO as it helps to mitigate the survivorship bias inherent in the narrower indexes like the S&P 500 that focuses on the existing top 500 largecap companies)1 ETFs YTD, the portfolio’s 27.76% return won out by a few percentage points:

Comparing to the theoretical indexes themselves, the portfolio just beat out the S&P by 2-3% and fell behind the tech-heavy NASDAQ by around 1% —looks like should have just quit while I was ahead in early December.

In the above chart, we can see my strategy for the portfolio of “do OK (or at least don’t lose very much) on the backs of the past winners I continue to let run, while hoping some of the portfolio’s smaller-sized call options —usually not literal call options contracts, but companies that act like long-lasting call options— give the portfolio an additional boost without having taken much additional cost-basis risk” payign off, where the portfolio did just fine through the majority of the year with a few larger bumps near the end as certain small “call options” (one literal and the rest figurative, in this case) happened to pay off in an outsized manner to the indexes. I’ve written a bit more about this idea in the past, here: https://lemoncakesinvesting.substack.com/i/45570065/the-logic-of-investing-in-non-perishable-optionality

********** UPDATE 20250221: We can put the portfolio’s 2024 results in greater context by looking a several other different indecies as well, from the Semper Augustus LLC 2024 letter (https://drive.google.com/file/d/1e2weviKQVWUklifj5RG7p_Zlmp0jJY_d/view):
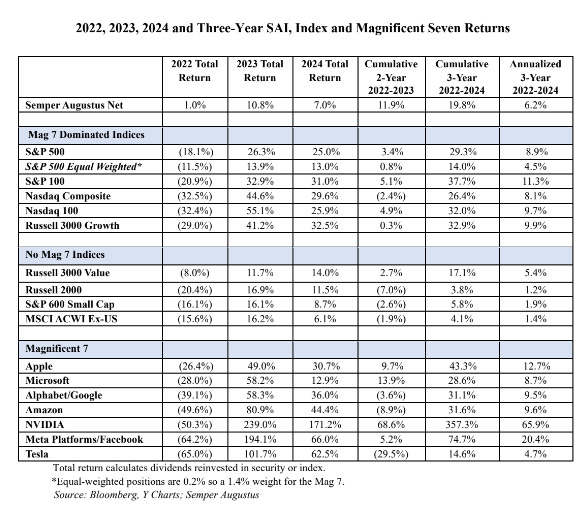
**********
Some of the larger contributions to performance came from continued holdings in TPL, Bitcoin (via ETFs, FRMO Corp, and Windland Holdings), and new addition GEO Group. Most of that drop off near the end of the year is due to the general pullback from peak in smallcaps and industrials (which is much of my portfolio) in addition to some individual losses in larger positions like FNV (after their recent earnings call) and PMD/PMDI (which has been unsurprisingly volatile after the reverse/forward-split and de-listing). There was also a loss of exactly 2% in December from speculative call options in the Kroger-Albertson’s merger (1%) and Nippon-US Steel acquisition (1% + continuing 1% equity position) —I thought they were good risk/reward setups and I thought my positioning was fine, but they just didn’t work out this these cases (unlike my GEO calls).
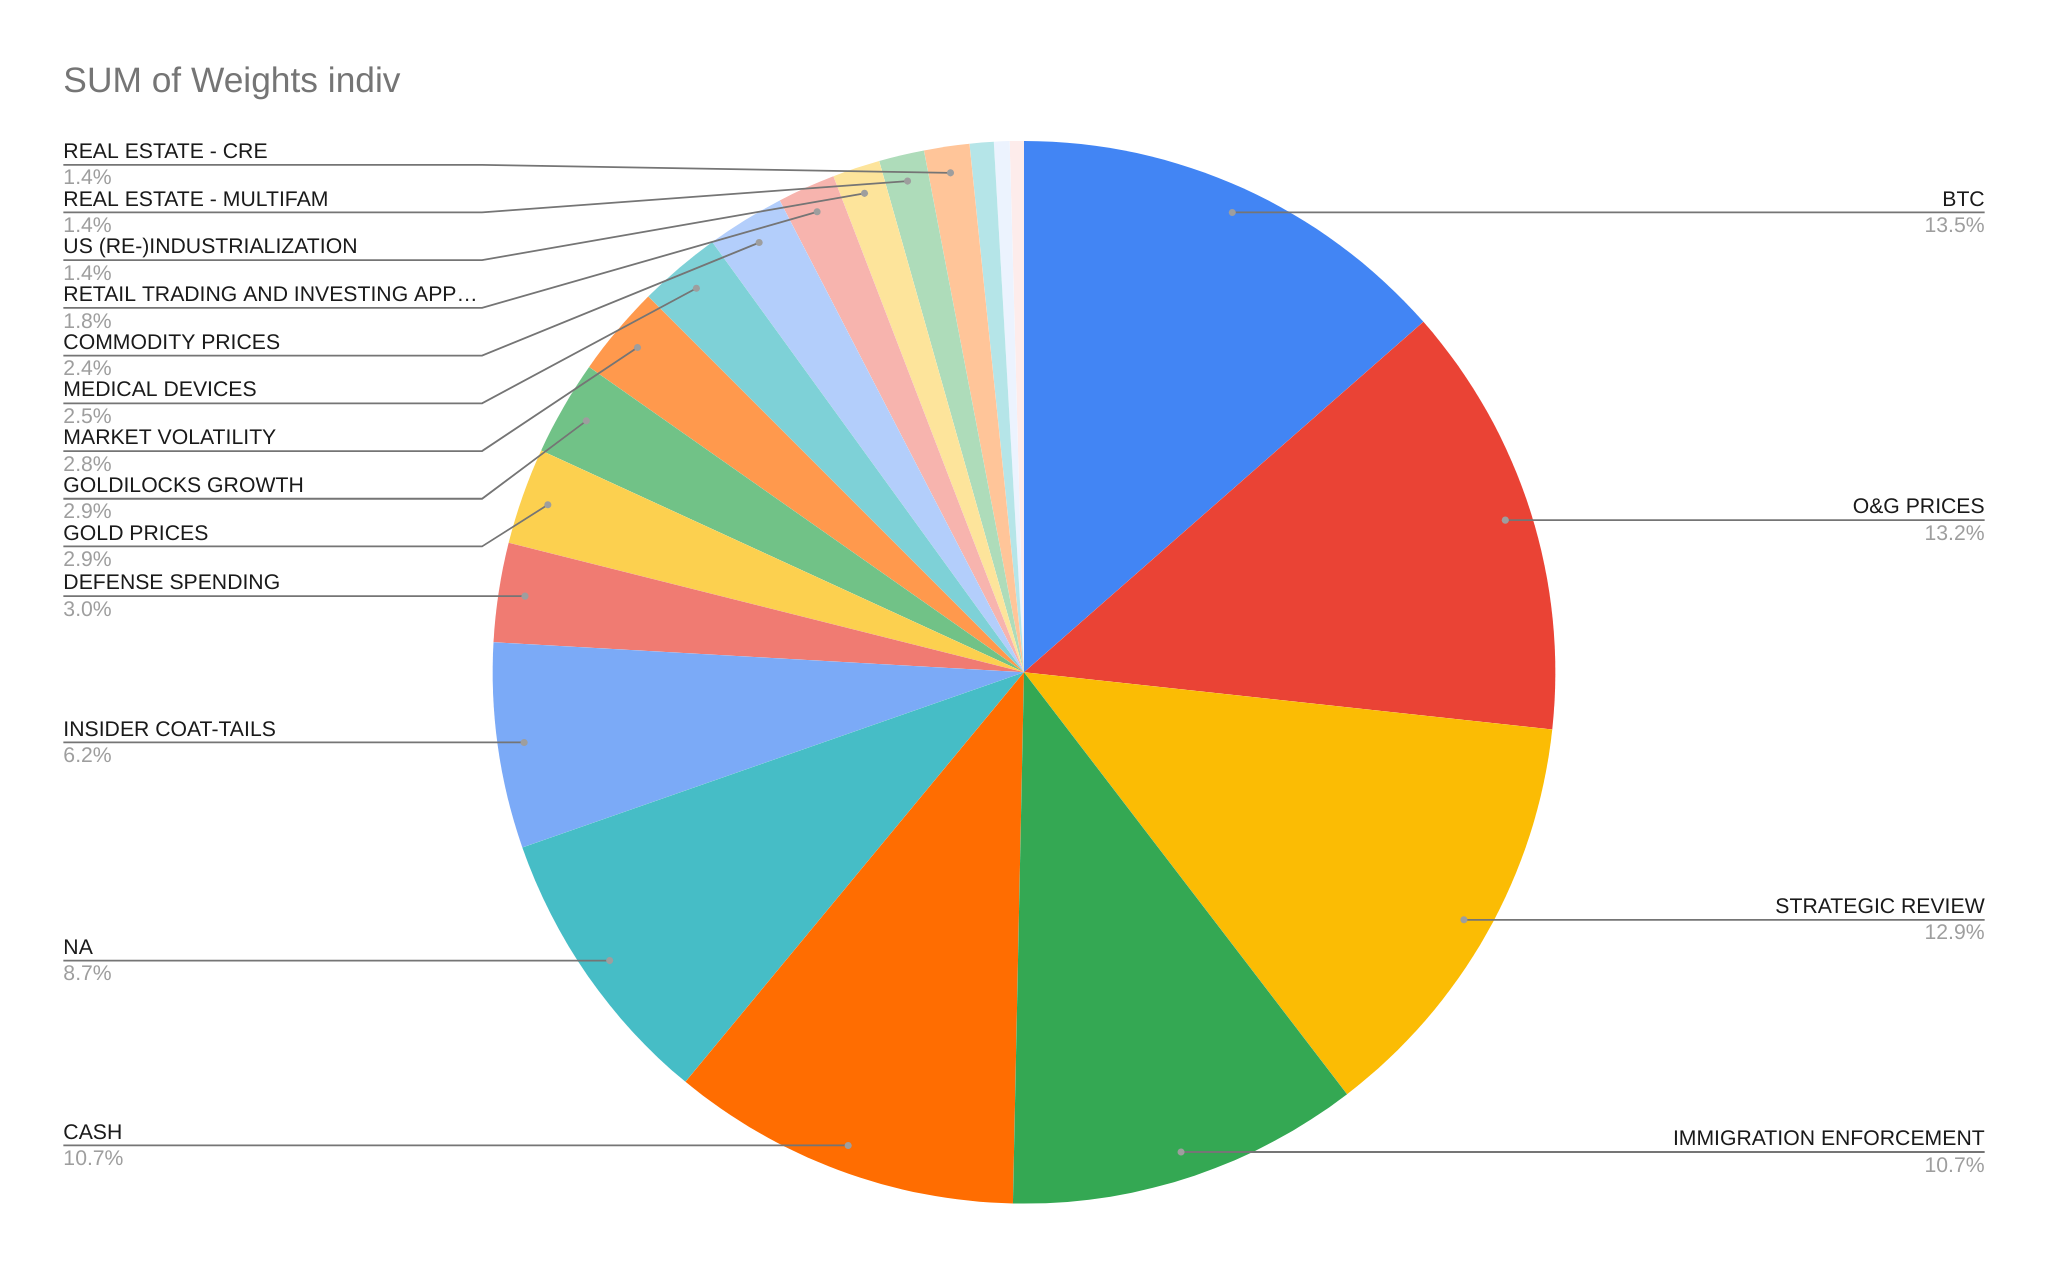
We can see the general breakdown of specific drivers and macro diversification of the portfolio here:
Considering the general quadrants of possible macro environments (with x-axis as GDP growth and y-axis as inflation rate and consider center at (2%,2%)), we can also look at a breakdown of the portfolio’s macro diversification vs the tech-plus-Tesla-heavy general market.


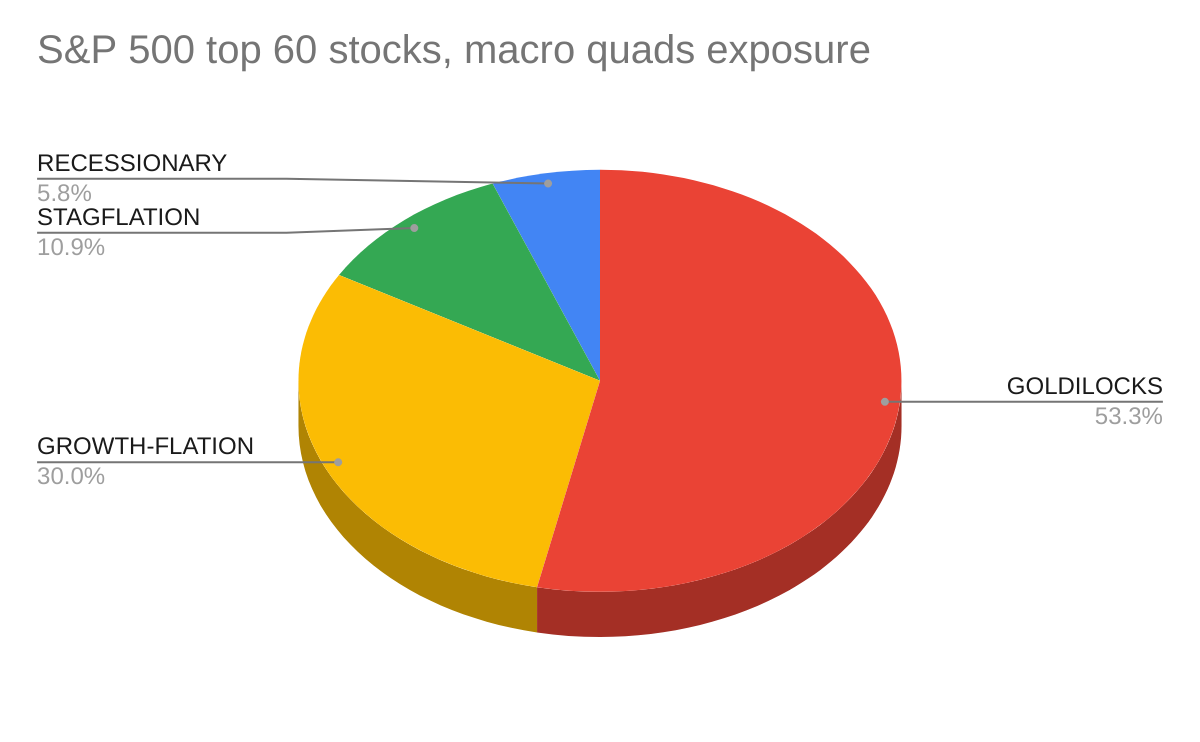
(The top 60 stocks of the S&P 500 make up 66% of the entire index; the way that I calculate all of these charts is detailed in the post here).
Portfolio top holdings / updates
Cash / money market funds (10%)
I look at cash as a recession and growthflation / interest rate hedge —eg. when markets are falling due to economic weakness or due to rate hikes being used to address inflation (causing asset price to fall).
This Buffett commentary from Berkshire’s 2014 annual meeting comes to mind:
“I’ve always said that, you know, cash is — available cash or credit — is a lot like oxygen: that you don’t notice it — the lack of it — 99.9 percent of the time. But if it’s absent, it’s the only thing you notice. And we don’t want to be in that position. So we will keep 20 billion. We will never go to sleep at night worrying about any event that’s taken place that could hurt our ability to keep playing our game. And above 20 billion, we’ll try to find ways to invest it intelligently. And so far, we’ve generally done it.”
Note that, at the time (May 3, 2014, but MRQ being reported for March 31), $20bn constituted 12-13% of Berkshire’s tangible book value and 8-9% of their total equity, so I think the amount I have presently is a fine amount —of course, in your personal life, one should also consider the discretionary cash they may also have in high-yield savings accounts outside of their investment portfolio. (Of course, as with anything re. Buffett’s investing or portfolio mgmt strategies, it’s important to consider the phase in his career in which these things were happening (here, well into the Berkshire-famous phase); I wonder if his earlier partnership was run as conservatively and, if not, why).
GEO Group (10%)
********** UPDATE 20250117: After exercising my remaining $12 call options, the portfolio is now 14% allocated to GEO. **********
I talked in greater detail about my investment case for GEO Group ahead of the November elections, here:

The setup was very amenable to a strategy of exposure via call options; I had an upside and downside PT that I was pretty confident in, with most of my baked-in fundamental assumptions made explicit, a known time schedule for when the high-impact fundamental changes would be happening for the company in the bull case (a Trump 2024 election win), and a reasonably knowable —or at least explicitly-stated— probability for that outcome (via the prediction markets). My use of options are often extremely simple wherein I mostly just use call options to allow myself to reduce cost basis value-at-risk, while still having claim to the same amount of underlying shares that my adjusted Kelly ratios suggest (which I based on the options’ breakevens) in case things played out in my favor; in this case they did.
Now the the election has been decided in Trump’s (and thus GEO’s) favor, I’ve exercised most of the options and will see how things start to shake out in early 2025 to determine if I’m going to hold the position in it’s entirety or start paring down to lock in some profits. Trump has promised strong action on immigration and deportations on day one of his inauguration, so it won’t be too long before we get a taste of the how the new administration and any political response thereto will affect GEO.
My 2026 PT for GEO is $42/sh, but we’ll see how much political will there really is for expanding immigration detention and ISAP projects once Trump is actually in office.
For their part, the company looks to be exiting survival mode and gearing up for what they believe to be “potentially unprecedented future growth opportunities.” Brian Evans served as GEO’s CEO from Jan 1, 2025 and announced that he would be retiring at the very end of the year on Dec 31, 2024. He is being replaced by J. David Donahue on Jan 1, 2025 (https://www.sec.gov/Archives/edgar/data/923796/000119312524279667/0001193125-24-279667-index.html; https://www.sec.gov/Archives/edgar/data/923796/000119312524074555/d717730ddef14a.htm#toc717730_4).
Evans’ experience was primarily in finance as he served as GEO’s CFO from 2009 to 2023 before his CEO appointment. Meanwhile, Donahue —who GEO is bringing out of his 2020 retirement in order to fill the CEO role— was more focused on operations at the company. To me it seems like GEO appointed Evans in 2024 for his financing experience as GEO faced an uncertain future and needed a finance person to make sure they could keep the ship solvent and work on paying down debt; Evans was “instrumental in successfully executing the Company’s strategy for three secondary public offerings of equity; the execution of multiple financing transactions; and the successful completion of major business transactions”.
However, now that Trump will be the incoming President in 2025 and has promised to enact a historic deportation project on “day one” of his Presidency, it seems like GEO is swapping CEOs for someone with more operational experience as it looks like those operations will be heating up bigly in 2025. Additionally, GEO promoted a former ICE COO Daniel Ragsdale as Senior Vice President of Contract Administration and Compliance, further hinting at heightened focus on ICE opportunities. The company also announced a $70MM investment in expanding capacity for ICE-related services, while also exploring the sale of under-performing state-owned facilities; again, emphasizing the focus on ICE operations.
Stephen Miller, Trump’s deputy chief of staff is predicting that Republicans in Congress could get a budget reconciliation bill (which only requires a simple majority vote of, the now Republican-controlled, Congress) to Trump’s desk by the end of January or early February. (https://thehill.com/homenews/administration/5033341-trump-prioritizes-immigration-policy/; https://www.crfb.org/papers/reconciliation-101)
As one final note, I also like GEO due the relatively low correlation of it’s fundamentals to the rest of the market. GEO’s main source of funding comes from government contracts, which puts the business on a different cadence that the rest of the market as government spending can be totally non- or anti-correlated to the general health of the wider economy. In GEO’s case, the incoming administration has (rightly or wrongly) identified illegal immigration as a primary source of inflation and a declining economic experience of average Americans and GEO will be a direct beneficiary of the government response to this conclusion. Regardless, I think that GEO will continue to exist in some form so long as the US has borders that is cares to enforce (noting that even when Biden signed his 2021 executive order restricting the renewal of private prison federal detention contracts, the EO only applied to DOJ/BOP contracts and not DHS/ICE). Furthermore, while this would not be reflected in the existing data, I expect that GEO’s new going-forward focus on lowering debt levels and continued refinancing will reduce it’s earnings sensitivity to capital market cycles and interest rates vs the past 2. I think of the position as swapping/diversifying market risk for policy risk.

GBTC/BTC/IBIT (10%)
Another big winner of 2024 has been Bitcoin and the incoming Trump admin has been seen as largely positive for the industry (https://archive.ph/aDdeA).
The majority of my position was bought during the 2022 “crypto winter” (which you can read about in a section of a previous post, here). I sold off all of my initial cost basis after BTC passed $100K late this year, but because of the big gains in BTC since buying the bulk of my position, that still leaves a rather large percentage of the portfolio in these Bitcoin ETFs.
As I’ve mentioned elsewhere, one consideration with owning GBTC or any other BTC ETF, now that GBTC is an ETF rather than a trust, is that the discount to NAV no longer occurs. Given this, it may be better for investors that want exposure to BTC to buy and hold the cryptocurrency directly (eg. via Gemini, Coinbase, hardware wallet, etc). One of the main advantages here is that owning BTC directly gives one the added call optionality of benefiting from any hard-forks of cryptocurrency that may occur in the future.
Given that not much about the protocol itself —nor restrictions on BTC ownership— have changed too much, neither have my general thoughts on BTC as an investment from when I first wrote about it, here:

FRMO/WELX/RCG (3% / 1% / 6%)
Collectively, I group these all as a singular Murray Stahl-based bet-the-jockey position. IMO, a big problem with this conglomerate is that manager Stahl is already rich and, by the way, never started HK or FRMO in order to get rich in the first place —rather he has stated that HK was founded as a way to allow Stahl and the co-founders to work on the problems they wanted to in the way they wanted to. I think this —in addition to his age, now 70— stops him from making bolder moves when he analyzes situations. Eg. he did not use FRMO’s large cash reserves to finish up buying their desired majority stake in WELX during the lows of the 2022 crypto winter, despite having stated many times in the past that FRMO’s incremental approach and conservative balance sheet management was so that the company could make bold moves at times when other crypto miners could not).
FRMO:
Composed mostly of public companies (even more so now that Horizon Kinetics Asset Management itself is a publicly traded company (OTCMKTS:HKHC)), you can basically create the returns of FRMO yourself without directly paying the book-value-premium for FRMO’s “intellectual capital” (which you can get for free every 3 months off of the company’s website of disclosures and earnings call transcripts). I’ve been selling down my position over time as the stock has risen over the year in exchange for RCG. Given the current SOTP, I don’t think it’s really worth putting money into FRMO unless it ever trades at a discount to TBV —or starts accumulating large positions in private investments that can’t otherwise be independently accessed publicly. As things stand, you can easily emulate FRMO by simply investing in TPL, HKHC, GBTC/IBIT, and WELX where relative amounts can be derived using FRMO’s own public disclosures. This is not so easily done with RCG, which has a lot more individual holdings (all very illiquid) as well as several private equity investments selected by Stahl.

“When you look at your portfolio and if you could emulate your portfolio without using the stocks in your portfolio, you’re not really investing in those stocks, you’re investing in a bunch of other factors that will give you the same return.” ~~~ Martin Shkreli (yes, that Martin Shkreli)
WELX:
Stahl-influenced crypto company; like a BTC fund that still has the ability to trade at big discounts (and, presently, premiums) in a similar way that the Grayscale Bitcoin Trust (GBTC) did before it converted to an ETF.
FRMO has stated that they plan to acquire WELX and run the mining business themselves, so it may be better for FRMO bulls to simply average into WELX (just as FRMO is doing) with the near certainty that you will likely being having your Winland shares exchanged for FRMO shares (plus maybe some cash) in due time. While both FRMO and WELX trade at a premium to SOTP value, I notice that FRMO tends to trade at a much greater premium vs WELX across time. It will be interesting to see how Stahl and Bregman do as crypto mining operators, rather than allocators, when that time comes.
One can calculate the existing SOTP value of WELX’s BTC + cash + PP&E NAV as well an simple NPV for the stagnant device legacy business, factor in some amount of BTC accumulation as the company mines and HODLs more crypto across t=1,2,3…, and come up with various price targets for different points in time. By my calculations (some which are shown below), it’s generally better to just buy IBIT or another direct Bitcoin ETF unless WELX is trading at a discount to it’s SOTP value. That is, I don’t think —using even if using rather optimistic assumed BTC mining/accumulation rates— that there are many cases where WELX is a better value than the BTC ETFs unless already trading at a significant discount to SOTP, but also that WELX is also more likely to trade at a discount than the ETFs are.
IMO, considering their historical BTC accumulation rates (and taking the LTC and BCH accumulation to be negligible given that their existing holdings are so small), there is almost never a time where buying WELX shares makes sense vs simply buying BTC ETF shares. The only exception is when WELX trades at a discount to it’s SOTP value in which case it is akin to buying a BTC fund at a discount to NAV (given the majority-BTC and cash makeup of their book value). This is because WELX’s BTC value needs to overcome it’s existing premium to SOTP (which I currently have 10%) before it starts to contribute to total NAV growth —noting that the legacy biz is totally stagnant and Stahl mentioning no interest in investing in its growth— whereas more direct BTC ownership does not have this handicap.


RCG:
This close-ended fund has a very similar major holdings to FRMO, but with a smaller crypto element. This disaggregation means that you can independently customize your crypto exposure to fit your comfort level —as mentioned before, FRMO’s crypto investments are largely via public companies that you can buy on your own (GBTC, IBIT, and WELX). Also, unlike FRMO, 1] the CEF trades at a discount to NAV (often greater than 20% discount), and 2] has more holdings, with several being more private company VC bets by Stahl, that makes the fund harder to replicate by simply buying the components individual on the public market. At the same time, RCG is still managed by Stahl, so you are getting the same chief investor and similar ideas, but at a discount, rather than at a premium.

While the discount to NAV has closed quite a bit this year, not much has structurally changed about the fund or it’s investments, so IDK that there’s much more to say on it. You can read my initial post on RCG, here:

TPL et al (10%)
Sold BSM from this oil & gas royalties basket simply to end the hassle of the annual K-1 form, yet still have the remaining basket of TPL and VNOM (simply holding the existing position from 2021, though they’ve both grown around 100% since that time) as well as a smallish position in LB (noticed the ticker in a recent holdings disclosure from the RENN Fund and thought was interesting).
.
People often associate TPL with Horizon Kinetics and consequently may sometimes equivocate TPL to LandBridge (LB) (whose shares HK has been buying and currently has a 30% stake in). However, keep in mind that, while “78% of [LB’s] pro forma [2023] revenue was generated from uses of our land and its resources to support the development and production of oil and natural gas”, LB does not own a lot of the subsurface mineral rights for the majority acreage they own the surface rights to. This makes them less sensitive to O&G price fluctuations (though this cuts both ways to the upside and the downside). The company expects that they will “acquire additional mineral interests only incidentally in connection with property acquired primarily for other purposes and, consequently, oil and natural gas is expected to become a smaller percentage of our total revenues over time” (https://www.sec.gov/Archives/edgar/data/1995807/000119312524172433/d752700d424b4.htm).
I would say, though, that IDK if there are a lot of great comps for LB beyond TPL. Both businesses focus on a mix of mineral and surface rights ownership (both collecting royalties or sale revenues from hydrocarbons, sand, and water), primarily generate revenues on hosting oil and gas operations, both have a shareholder base that is also pricing in the potential for hosting renewable energy and AI projects, and both are in component basins of the larger Permian basin (LB being in the Delaware basin and TPL revenues mainly focused on Delaware and Midland) 3. Below, I’ve overlaid LB’s acreage map (colored) with TPL’s (black and white):
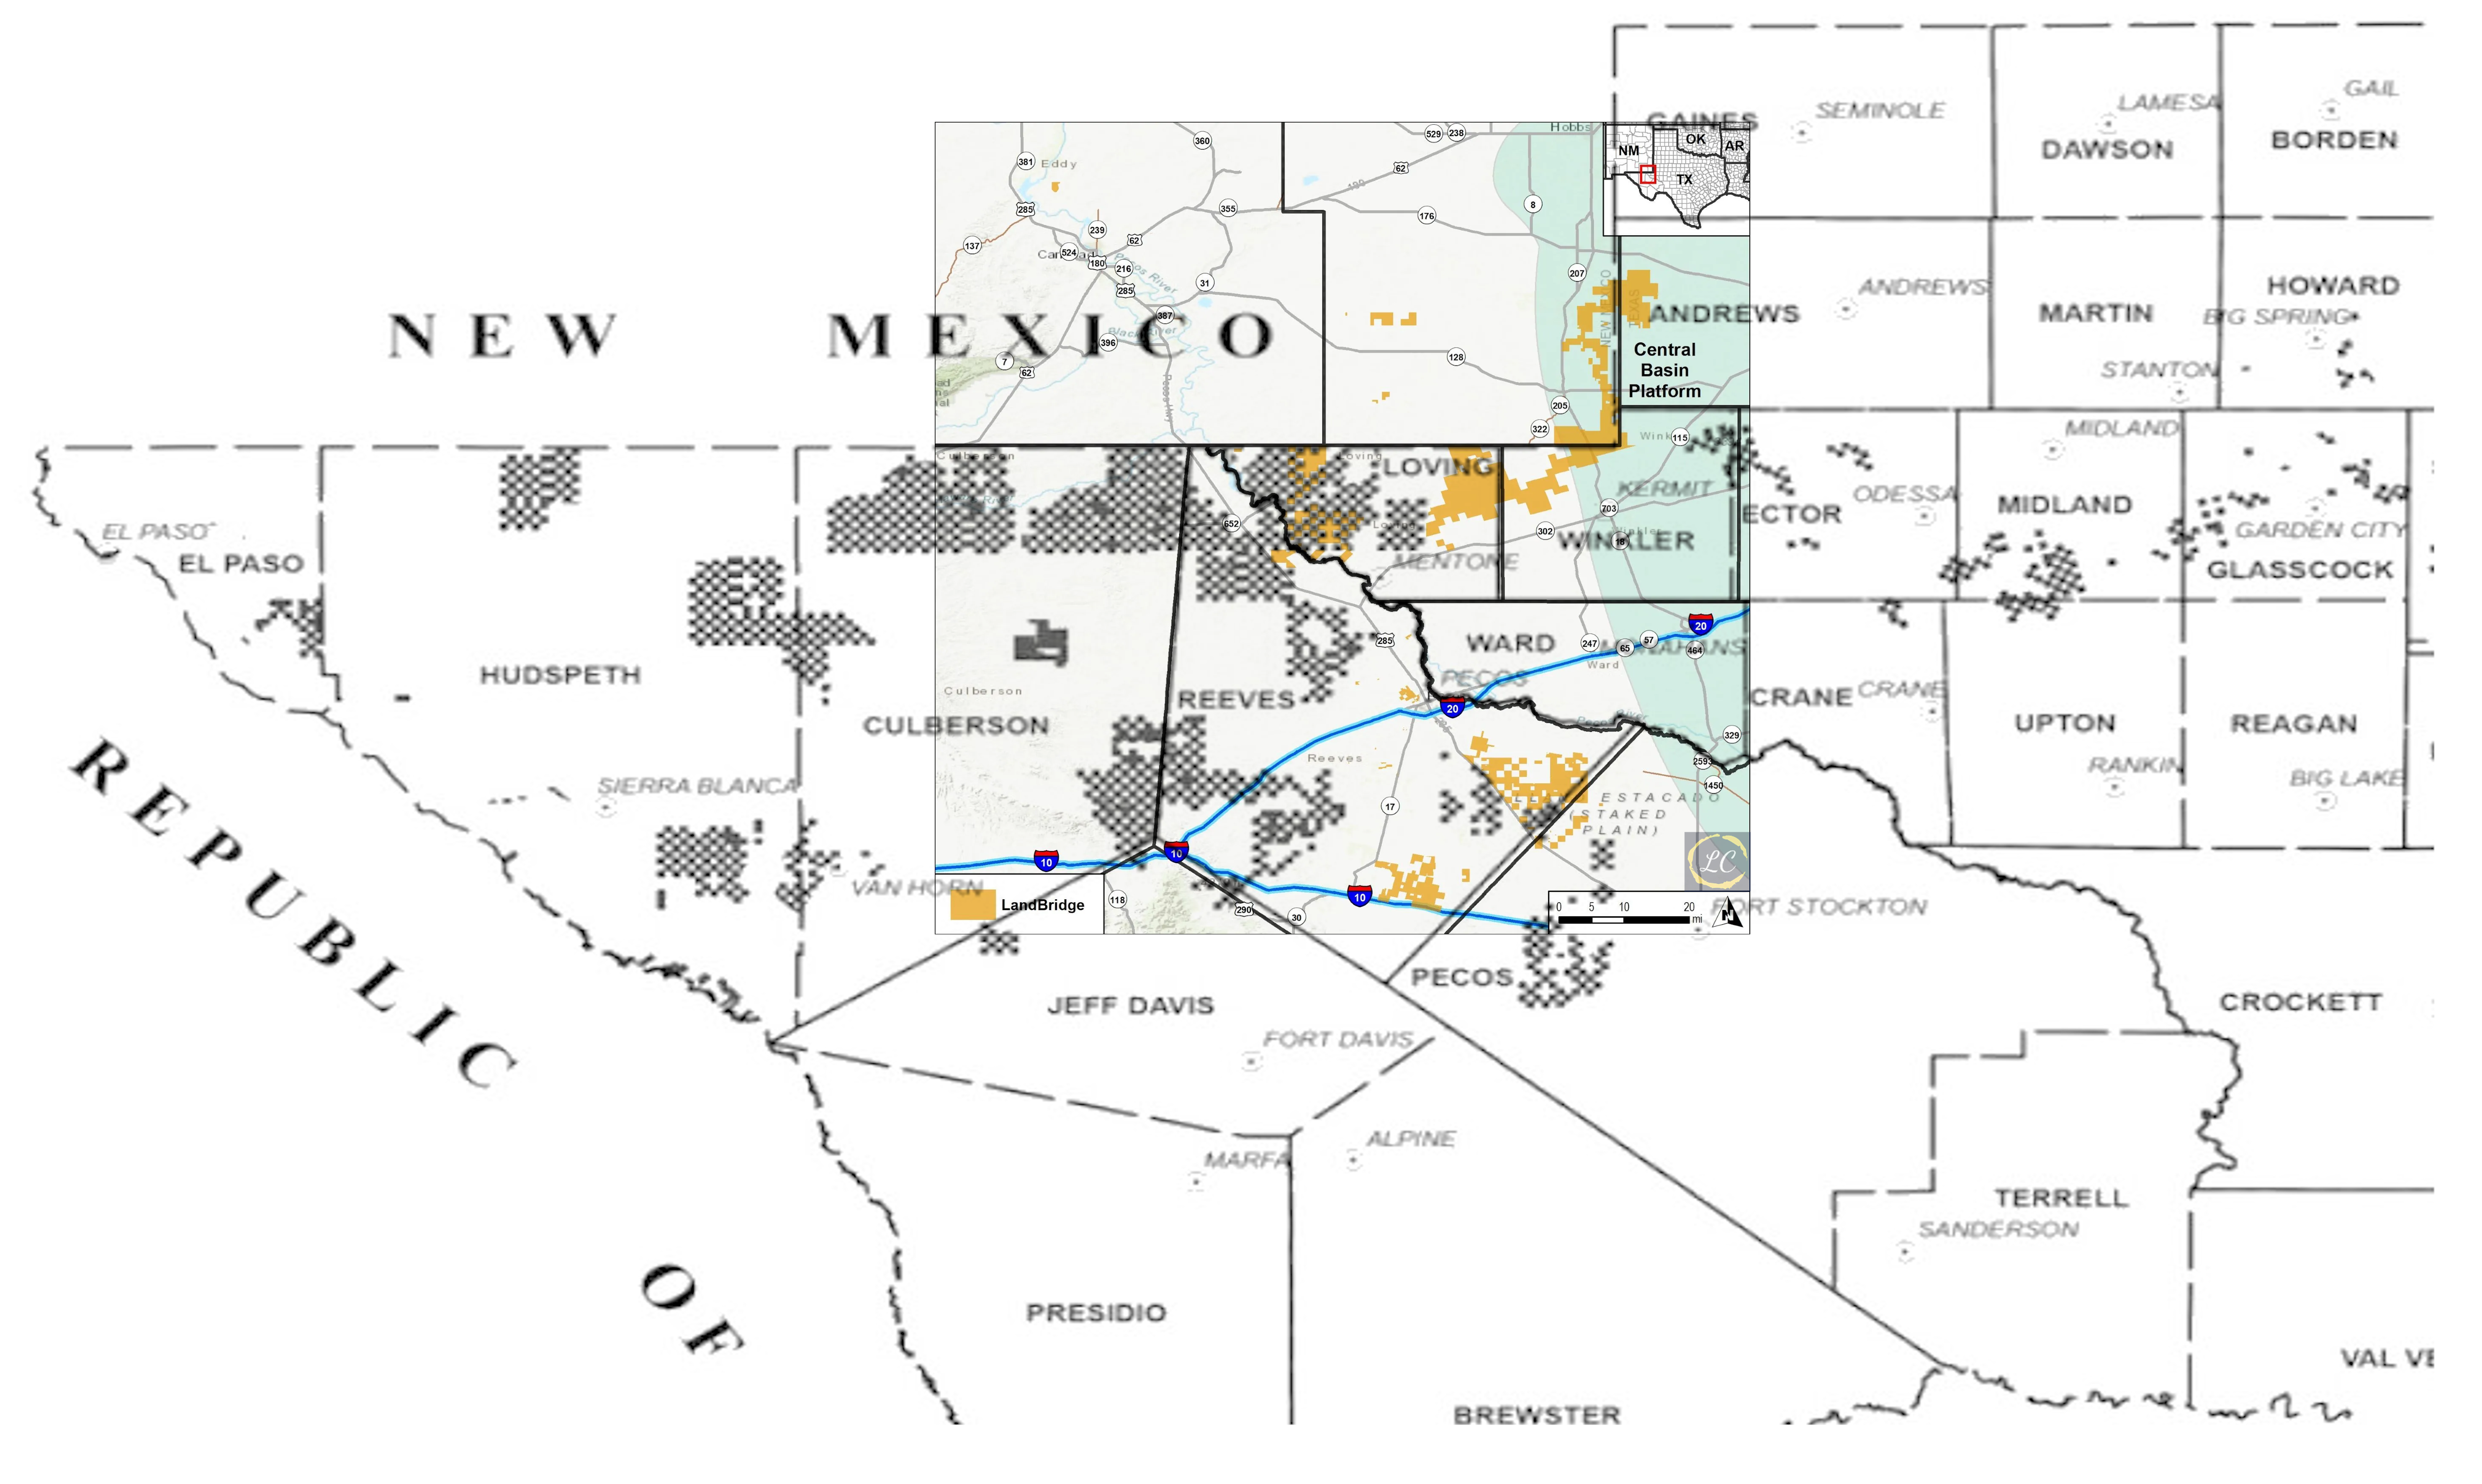

(And, just because I mentioned the name earlier, here’s TPL and LB acreage overlaid on VNOM’s acreage (light yellow and light green) for even more of a mess)

(https://www.landbridgeco.com/about739ec34a; https://www.texaspacific.com/investors/presentations; https://www.oilandgaslawyerblog.com/the-tplt-proxy-war/; https://www.viperenergy.com/news-releases/events; IDK that some of that Loving county TPL area in the second map is still totally accurate)
(Other maps of interest: https://www.rrc.texas.gov/resource-center/research/gis-viewer/ (see https://www.rrc.texas.gov/media/kmld3uzj/digital-map-information-user-guide.pdf); https://www3.twdb.texas.gov/apps/waterdatainteractive/groundwaterdataviewer)
On the subject of LB’s surface rights coverage, one interesting thing from their prospectus was the discussion of a regulatory arbitrage that makes their land and water sources and treatment/disposal locations more attractive to New Mexico operators in the Eddy and Lea counties due to the relative laxity of regulations on the Texas side (as opposed to New Mexico operators trying to gets those same resource infrastructure permitted and developed on their own side of the border).
“In contrast to New Mexico, Texas generally provides a more favorable regulatory environment for produced water permitting. Between January 1, 2021 and March 31, 2024, the Texas produced water permitting process has taken an average of 171 days from initial submission to approval for produced water handling facilities located in the Delaware Basin (as defined by the EIA’s Permian Sub-Basin boundary), compared to an average of 655 days in New Mexico for produced water handling facilities located in the Delaware Basin over the same time period. Furthermore, we believe that New Mexico regulatory agencies have been less likely to approve shallow geological produced water handling wells. Only 30% of all approved permits in the Delaware Basin in New Mexico from January 1, 2021 to March 31, 2024 were for shallower intervals (defined as injection formations above the top of the Woodford formation), compared to 99% in the Delaware Basin in Texas over the same time period. Building infrastructure for deep geological produced water handling is time consuming, operationally complex and expensive, which increases the economic risks and limits operational flexibility and certainty desired by water midstream companies and E&P companies. The combination of favorable geological characteristics and a comparatively less restrictive regulatory environment drives increased demand for produced water handling facilities on the Texas side of the Texas-New Mexico state border. […] New Mexico also presents a more restrictive regulatory and hydrological environment for sourcing brackish water used for oil and natural gas well completion activity. As a result, much of the brackish water supplied to the oil and natural gas industry in New Mexico is sourced from Texas. Our Stateline and Northern Positions contain significant underground brackish water sources from which brackish water can be produced for sale to companies that deliver this water to E&P companies in New Mexico for use in their drilling and completion activities.”
This strategic positioning between Texas and New Mexico is also mentioned by TPL director, Eric Oliver, here.
We can further see how LB is looking to benefit from this Tex/NewMex regulatory arbitrage by examining a map of, sister company, WaterBridge’s (WB) active and planned water-handling pipelines across the two states and into LB acreage. WB is the largest pure-play produced water midstream company in the US and operates a large-scale network of pipelines and other infrastructure in the Delaware basin (where I believe it’s the largest pipeline network in the area):
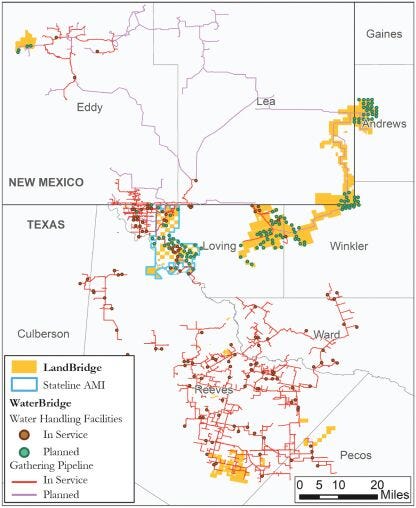
(“WaterBridge Assets Map”, https://www.sec.gov/Archives/edgar/data/1995807/000119312524172433/d752700d424b4.htm; note that this older map does not include the Wolf Bone Ranch property, acquired in December 2024, that can be seen between the southern Reeves county position here and Ward county line in the previous maps) 4
(I wish this map included a breakdown of what specific type of water handling facility each dot represented, eg. brackish water sourcing/distribution vs produced water treatment/recycling/disposal). 5
Something to note about pipelines like these is that they have a kind of incumbent advantaged, network effect where it costs less for an incumbent to extend an existing pipeline rather than for a new entrant to try to build out a whole new network to compete with the incumbent. Given WB and LB’s shared management team and existing agreements, it would be safe to assume that LB will also be benefiting from those network effects as they will be able to coordinate development plans. (I think of the relationship between Diamondback (E&P) and Viper Energy (mineral rights owner) as being somewhat analogous). For example, one of LB’s biggest drivers of expected 2025 EBITDA is the increased surface use royalties from the handling of produced water expected from a long-term partnership struck in August 2023 between WB and an E&P company, Devon Energy, where WB will handle all of Devon’s produced-water within a large area of the Delaware basin, which will ultimately result in increased use of LB lands on which WB asset handle produced-water treatment and disposal. 6 7
.
Because the mix of royalty types at LB vs TPL is so different (LB’s revenues nearly completely based on surface royalties and easements whereas TPL’s is a bit more evenly split between surface and mineral rights), we can’t directly comp their price on purely a per surface- or net-royalty-acre basis, exclusively. One thing we can maybe do is look at their revenue mix and create a weighted use-based acreage unit (WUBA) for each company and see how much each company’s present and future growth is being valued per WUBA (here using most recent quarter data for TPL and LB as well as TPL’s 2023 10K and LB’s initial filing prospectus for additional info)…
TPL: 57% of MRQ revenue came from oil and gas royalties (NRAs); 43% from surface-related acreage (SA).
LB: 90% of MRQ revenue came from surface acreage (SA); 10% comes from oil and gas royalties (NRAs).
WUBA = SA*(surface revenue mix) + NRA*(oil & gas revenue mix)
TPL: Market Cap = $26,811MM (as of Dec 27 2024); Surface Acres = 868,446; NRA: 199,000 acres
LB: Market Cap = $1,110MM (as of Dec 27 2024); Surface Acres = 220,000; NRA = 7992.16 (= 4,180 gross mineral acres * 0.239 avg weighted royalty interest * 8, if we’re normalizing to 1/8th)
(Note that double-counting is not an issue here since we are accounting for two different types of economic resource, but also the majority of LB’s mineral acreage directly underlies it’s surface acreage (96% per their prospectus)).
This give us values…
WUBA (TPL) = (868,446*0.43)+(199,000*0.57) = 486,862 WUBA
WUBA (LB) = (220,000*0.90)+(7992.16*0.10) = 198,799 WUBA
Price to WUBA (TPL) = $26,811MM/486,862 = $55,069/WUBA
Price to WUBA (LB) = $1,110MM/198,799 = $5,584/WUBA
From this POV, LB is orders of magnitude cheaper than TPL.
Of course there is even more that one could drill into on this route if we consider the fact that not all surface- or mineral-acres are equally valuable/productive, making the differences in acreage types even more problematic; acreages can differ in quality across sub-basins and across individual acres within the same basin (thus attracting more or less operators to utilize those surface or mineral acres). There is also the issue of cost structure, as the earnings contribution mix from the various business lines may be very different to how things appear at the top-line, but neither company breaks this out. Furthermore, it’s not hard to find things cheaper —on almost any relative basis— than TPL; I’d be curious to comp LB’s price-to-WUBA against other, more surface-based comps, if I could find any.
Lastly, I’d note that LB does not seem to have quite the same degree of optionally as TPL because LB is mostly surface rights (vs mineral rights). More and more oil can be discovered underground or new technologies can be developed to economically extract more resources, but IDK that you’re going to find more surface on your surface acreage (though maybe more or more-efficient uses for existing surface) —though, as I mentioned, this oil-price sensitivity is a double-edge sword. Thus, we can’t really treat surface- and mineral-acres as having the same value or growth potential and just split by present-day revenue mix.
.
Some lingering TPL/LB things I’m thinking about…
How much of TPL and LB’s strategic value comes from its particular physical location along the Texas - New Mexico border versus intelligent operation (which could theoretically be copied by well-funded competitors) or from the particular quality of their mineral acreage (of which better deposits could theoretically be discovered elsewhere in the US that could divert operator development dollars, eg. in California if the politics there were ever to change or internationally in Argentina shale given the new political environment there)? That is, how critical is the position along the Texas - New Mexico border to the value of TPL/LB and are there other private or public competitors that can just as easily facilitate competing land use agreements with TPL and LB's potential customers? Is it the scale of contiguous land tracts that make their assets unique? I’m still trying to get an idea of the competitive landscape for TPL and LB's land operations and who management sees as these companies’ most significant public and private comps.
********** UPDATE (week of) 20250121:
Asking this question during the recent FRMO shareholder meeting, mgmt had already had much to say about, not just TPL/LB’s positioning along the Texas - New Mexico border —as it pertained to facilitating regulatory arbitrage activity by New Mexico operators— but about the (continually reusable) value of the brackish water underlying the acreage and the major role they believe it will play in AI and data center cooling —in addition to the value of future easements associated with the infrastructure that will be required to feed energy, water, and data in/out of those data centers, which many TPL and LB discussions like to cover. (One risk I see to LB’s water value as it pertains to data centers is the prospect of data centers being built with closed-loop water cooling systems that recirculate a fixed supply of water, rather than needing to continually contract with WB and LB to recycle and replenish the water that traditional evaporation systems require. I suppose LB could charge the data centers a one-time price that is X times the $/bbl price they charge to evaporation-cooled ones, where X is proportional the expected lifetime of the water being taken, but it would still seem to detract from LB’s water advantage).

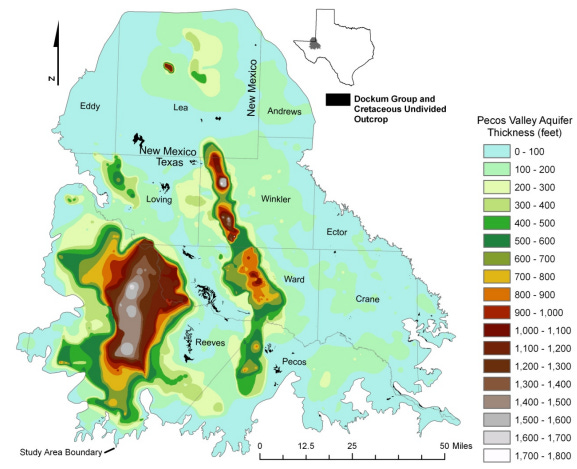
Management pointed out that LB/TPL land sits atop the Pecos Valley aquifer which is continually recharged by the surrounding mountain ranges and playa lakes (see https://gsa.confex.com/gsa/2008AM/webprogram/Paper142825.html; https://www.texasalmanac.com/articles/aquifers-of-texas; https://texasaquaticscience.org/aquifers-and-springs-aquatic-science/; https://www.twdb.texas.gov/publications/reports/numbered_reports/doc/r380_aquifersoftexas.pdf; https://www.twdb.texas.gov/groundwater/docs/studies/TexasAquifersStudy_2016.pdf; https://www.twdb.texas.gov/publications/reports/numbered_reports/doc/R382_PecosValley.pdf).
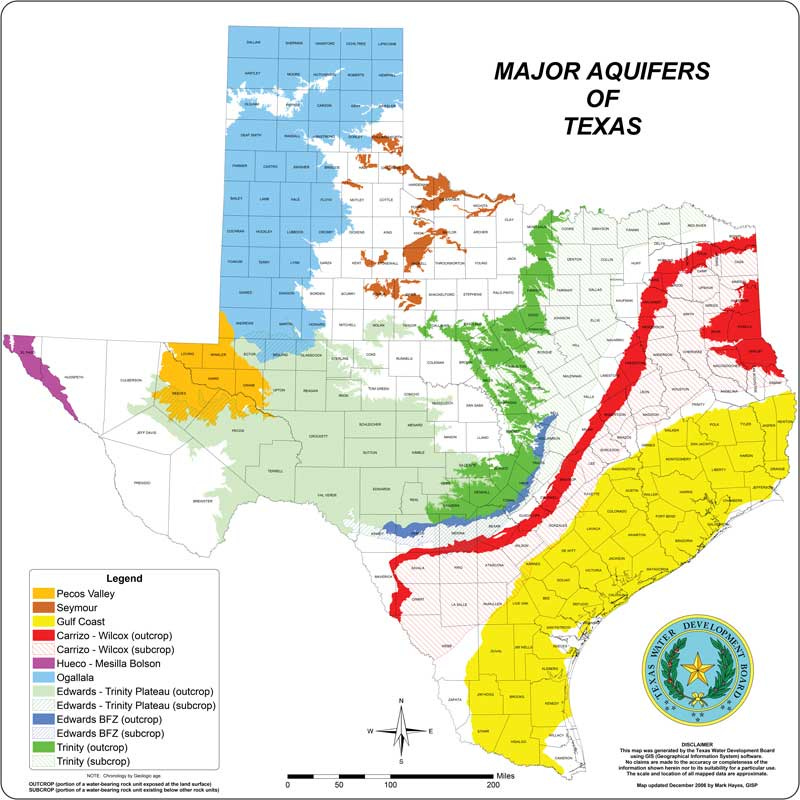

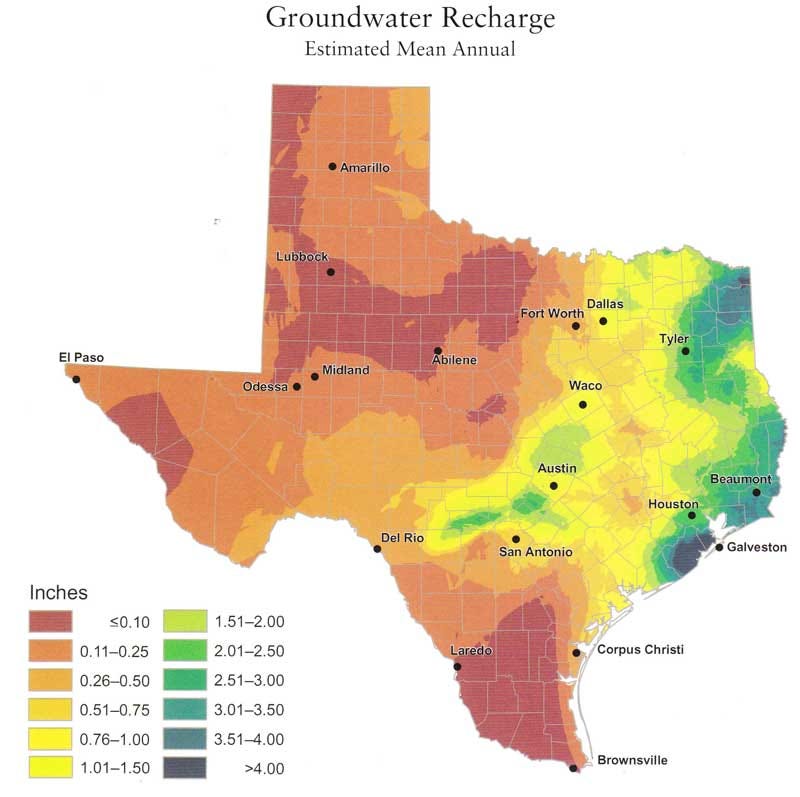


It may be interesting to compare this depth map to the map of TPL and LB acreage displayed earlier in this post. TPL covers some of the thickest cross-sections of the aquifer (ie. most water) in Reeves and north-east of Loving (along with LB), while LB covers some of the thickest parts in the north-east of Winkler (overlapping the Capitan Reef Complex minor aquifer, https://www.twdb.texas.gov/groundwater/models/gam/crcx/ConceptualModelReport_Final.pdf)

One would have to model the incremental cashflows to TPL/LB’s extremely-captial-light business in order to understand the data center opportunity. Doing this as a theoretical exercise might not even be necessary and we may soon see real-world examples of this very kind of development as Trump has recently signed several relevant executive orders. The EOs in question are relate to US energy policy (https://www.whitehouse.gov/presidential-actions/2025/01/declaring-a-national-energy-emergency/; https://www.whitehouse.gov/presidential-actions/2025/01/unleashing-american-energy/) which 1] directs agencies to review regulations burdening domestic energy resource development as and 2] orders the expedited permitting for energy projects deemed essential for national security (https://www.morganlewis.com/blogs/powerandpipes/2025/01/trump-vance-administration-issues-executive-order-to-promote-american-energy). The second relates to AI which repealed the previous Biden admin’s 2023 executive order on AI safety and regulation (https://www.reuters.com/technology/artificial-intelligence/trump-revokes-biden-executive-order-addressing-ai-risks-2025-01-21/; https://fedscoop.com/trump-rescinds-biden-ai-order-creates-doge-orders-in-person-work/), meanwhile —just as a sign of how the winds are blowing for new data center development— a joint venture has been announced between OpenAI, SoftBank and Oracle which plans to invest billions in AI infrastructure development (https://archive.ph/21IgD; https://news3lv.com/news/nation-world/trump-axes-bidens-executive-order-on-artificial-intelligence-plans-to-invest-billions-chat-gpt-apple-ai-elon-musk-sam-altman-openai-congress-legislation-safety-advocates). Trump also recently signed an executive order “removing barriers to American leadership in artificial intelligence” which is intended to “revokes certain existing AI policies and directives that act as barriers to American AI innovation, clearing a path for the United States to act decisively to retain global leadership in artificial intelligence” (https://www.whitehouse.gov/presidential-actions/2025/01/removing-barriers-to-american-leadership-in-artificial-intelligence/).
Just for fun, we can try to model in the near-term data center opportunities based on comment from management and some info I could find around data center water usage and acreage requirements (https://dgtlinfra.com/data-center-water-usage/; https://westernlandowners.org/water-rights-restoration/; https://www.cushmanwakefield.com/en/united-states/insights/data-center-development-cost-guide):


(And this does not take into account any additional easement revenues for the infrastructure that would be required to bring the power and water resources to the facility, nor for the infrastructure easements related to installation of transmission lines, substations, underground cables, or telecommunications infrastructure; not to mention the deflationary element )
**********
********** UPDATE 20250125:
A small Chinese company called DeepSeek recently open-sourced an AI/LLM model of the same name which, to my understanding, was notable not only for beating or performing comparably to the major US LLMs across the most common benchmarks, but for doing so while making massive efficiency gains on training and deployment compute requirements (https://www.yahoo.com/news/u-just-pledged-hundreds-billions-023900941.html; https://www.cnbc.com/2025/01/24/how-chinas-new-ai-model-deepseek-is-threatening-us-dominance.html; https://archive.ph/2eYBu; https://daily.dev/blog/deepseek-everything-you-need-to-know-about-this-new-llm-in-one-place).
My takeaway is that it should be expected that kWh (and subsequently acreage and water) requirements for data centers, for which LB aspires to sell/lease water and acreage in order to facilitate, should come down and be deflationary over the medium- to long-term as tech companies continually improve the efficiency of their technology and algorithms. As evidenced by the recent step-wise efficiency gains of DeepSeek, it appears deflationary forces may be a lot stronger —and a lot more unpredictable— than companies expect. I’d guess that, going forward, companies will be much more cautious about the actual deployment of AI data center capex as they realize that the cost per token of inference for the same volumes of token usage can rapidly decline, sometimes overnight.
Consider this in tandem with Jeff Bezos’ vision of AI output as becoming a base layer commodity used in a similar way —for applications yet to be fully enumerated in the market— to how water powers a waterwheel or electricity runs your refrigerator (https://archive.ph/06sOO). I think a major risk to LB’s data center thesis in the long-run is that kWh requirements (and thus water and acreage requirements) per unit of AI output ultimately decline over time at a rate much faster than what may be offset by the rate of adoption/integration of AI output such that they necessitate additional data center build-outs. Efficiency gains pull total data center water and land utilization down, while profitable/sustained adoption lifts utilization up; a new data center need not be built if you can just replace an existing facility with more efficient chips running a more efficient model (that performs just as well if not better then the previous one a la DeepSeek). LB owners should hope that Jevon’s Paradox —as many nervous AI investors are citing— applies here (https://en.wikipedia.org/wiki/Jevons_paradox) strongly enough for incremental data center capacity / infrastructure demand spending to win the tug-of-war vs innovation-driven kWh-per-token deflation.

(https://transportenergystrategies.com/2023/01/26/the-jevons-paradox-applied-to-electromobility/)
While LB currently has zero such facilities on their lands at the moment, which I’m very confident will not remain the case as I don’t think I we’re very near whatever steady state resource equilibrium AI efficiency-vs-adoption is going to eventually end up at, the proper multiple on EBITDA, EPS, FCF, or whatever for LB’s price to reflect that growth into the future is another question.
**********
.
On the whole, not much has changed here since my previous portfolio review where I mentioned that the failure of climate change policies is resulting in an increase in demand for coal, oil, and especially natural gas. It seems likely that governments and businesses, no longer able to hide the inadequacy of green-energy policies, will turn to fossil fuels like natural gas as a more viable option, leading to a surge in demand beyond current forecasts. Investments in oil and gas may become more attractive as the narrative shifts away from strict adherence to ESG ideals.
The political push away from fossil fuels to green/renewable energy technologies is the first energy transition that is 1] artificially imposed (being legislated into existence vs being pursued by organic market forces seeking a better energy efficiency product), is 2] going from a more efficient energy source to less efficient ones, and 3] attempting to remove, by force, the use of the incumbent (and more efficient) energy source, rather than expecting natural competitive forces to result in the phasing out of the older source (which one would expect to happen if the newer source were actually superior). Green energy politics picked a fight with physics and appears to be losing (https://www.city-journal.org/article/the-magical-thinking-behind-the-energy-transition; https://www.hartenergy.com/exclusives/physics-limits-green-dreams-184328).
********** UPDATE 20250225: In a similar vein, this was an interesting article on the realities of the attempted energy transition: https://www.foreignaffairs.com/united-states/troubled-energy-transition-yergin-orszag-arya

**********
.
As AI has been a major stock market theme for 2024, TPL’s largest stakeholder, Horizon Kinetics, has painted a rosy picture for how some of these holdings may benefit from the recent growth of AI in a recent quarterly commentary (https://horizonkinetics.com/app/uploads/Horizon-Kinetics-Q3-2024-Commentary_Final.pdf, see “Next Up: When AI Meets the Permian Basin.”), but I’m not really sure what to make of that story as of right now —and it really is just a story at the moment (with Stahl noting that there were no data center construction projects planned for TPL, to his knowledge as a member of the BoD, as of Sept 5, 2024 (https://www.frmocorp.com/_content/letters/2024_FRMO_Transcript.pdf, see “Questioner 4”)).
In any case, I think the general idea is summarized well here…
“[T]here is a significant timing mismatch between the speed with which nuclear plants can be brought online for AI and the urgency of the industry’s electricity demand. […] Things that do the same thing don’t sell for different prices indefinitely, and hydrocarbons will be no exception. Either by changing the engines or manipulating the molecules or a combination of both, arbitrage will prevail. […] As the cleanest-burning hydrocarbon capable of producing a steady supply of baseload electricity, natural gas is inherently well-suited to meet the application’s needs. If Microsoft is willing to “overpay” for nuclear, surely natural gas, which can be rapidly deployed to create electricity at scale, is substantially more valuable than current prices indicate?” ~~~ Doomberg (on AI and energy demand)
.
There is also the issue of how Trump’s energy secretary pick, Chris Wright, will affect overall oil prices and production volumes? It seems that the US oil industry would like the Trump admin to expand LNG export capacity and lease more Federal lands for exploration.
My understanding is that much shale hydrocarbon supply constraints in recent years have been due to reduced land leasing and insufficient off-take capacity from drill sites (ie. due to slow or cumbersome Federal land leasing and pipeline development permitting processes from the Biden administration). The incoming Trump admin’s aim to reduce red tape for private sector development of energy infrastructure could result in increased development and use of surface acres on TPL and LB lands as E&P, oilfield services, and midstream operators see quicker permitting for, say, water handling, sand mining, drilling, and pipeline construction. This could end up being net positive or at least offset the impact of any reduction in oil prices achieved by the Trump admin —though LB is more directly linked to activity and volumes whereas TPL is much more exposed to oil and gas prices, with more than half of it’s revenues from generated from mineral interests.
It seems, in this POV, that LB has similar characteristics to a stock exchange where they make money on “volumes”. In the case of a securities exchange it’s on volume of trades that go through the exchange, while with LB’s surface rights it’s about the “volume” of drilling activity and other energy projects that require land and water usage (on which LB collects easements, sales revenue, and royalties). While similar to a midstream pipeline owner, LB dosen’t need to spend anything on maintenance capex and have multiple options for how they can profit from the land they acquire through growth capex that can happen immediately (rather then needing any of their own infrastructure to be up and running beforehand).
One example I’ve seen used to demonstrate the magnitude and uses cases for which red-tape-cutting could speed energy infrastructure development —and ties into the previously-mentioned AI opportunity for surface rights owners in the Permian— is the data center that was built by Elon Musk (apparently without first getting the proper permitting and circumventing local government approval) to power X/Twitter’s Grok AI, which —rather than using a connection to the local electrical grid— relies primarily on gas turbines and was built in under a month (https://www.reuters.com/business/environment/musks-xai-operating-gas-turbines-without-permits-data-center-environmental-group-2024-08-28/; https://time.com/7021709/elon-musk-xai-grok-memphis/; https://www.cnbc.com/2024/08/28/musk-xai-accused-of-worsening-memphis-smog-with-unauthorized-turbines.html).
Depending on the balance between natgas production and North America’s export capacity, greater exports could mean domestic supply deficits and thus higher energy prices. The US currently enjoys much cheaper natgas prices vs the rest of the world as massive amounts of imports of Canadian, Mexican, and US domestic production are bottlenecked and locked into North America due to insufficient export capacity. As more export capacity is built in the US to reach foreign markets —while the most productive domestic natgas plays begin reaching production plateaus— US consumers may go from a natgas surplus to shortage as LNG is exported to the rest of the world to profit from the pricing arbitrage and prices balance out somewhere in the middle. This idea is also articulated in the a Goehring & Rozencwajg letter here and in a MacroVoices interview here.

(BTW, Trump’s plan to “drill baby drill” does not seem like a desirable domestic policy from a very-long-term POV. Better to let others empty their own countries of their domestic natural oil reserves first, as there is no guarantee that a more scalable, energy-efficient, energy-dense, and transportable source of fuel will ever be found to replace it). 8
“Every barrel that you use up that comes from somebody else is [one less] barrel of your [own] precious oil which you’re going to need to feed your people and maintain your civilization.” ~~~ Charlie Munger
FNV (5%)
Whereas cash can hedge a portfolio against deflation caused either by a recession or the Fed’s response to growthflation, gold hedges a portfolio in situations where inflation simply can’t be addressed by rate hikes (or where governments do not have the will to use rate hikes due to already-weak economic growth). That is, I see cash as a (managed-)growthflation hedge and gold as a stagflation hedge —and both as a valid recession hedge (if/when governments cut rates).
.
Looking at the movements of gold vs real rates, which typically move inversely to each other, we see that trend has departed over the last 2 years 9:


It could be the case that gold prices are indicating bearishness on real rates, either due to worsening inflation or anticipation of a move to deflation and lower rates caused by economic weakness. (I suppose you may have to ask yourself: Who is more sophisticated? The bond market or gold market? Who really moves the respective markets the most?) Central Banks have been net gold buyers through 2024 (https://www.gold.org/goldhub/gold-focus/2024/12/central-bank-gold-statistics-october-2024; https://www.gold.org/goldhub/research/gold-demand-trends/gold-demand-trends-q3-2024/central-banks) and one may be inclined to say that CBs know something others don’t 10. (BTW, I’d note that the CB net buying figures that I often see in major news outlets are usually all sourced from the World Gold Council who include confidential estimates factored to their buy/sell figures that should be taken with a big grain of salt (https://www.bullionstar.us/blogs/ronan-manly/gold-remains-strong-as-central-banks-sustain-upward-gold-buying-trend-in-2024/)).
.
FNV posted a 12% decline in YoY earnings and 11% decline in YoY revenue for 2024Q3. The stock fell a corresponding 15% from $133 to a low of $113 in the following days. These issues were mainly due to slower-than-expected ramp-ups at new mines and lower grades and production figures at the Candelaria open-pit mine due to underground cavities from previous, underground mining activity. (https://finance.yahoo.com/news/franco-nevada-earnings-miss-estimates-172800074.html)
When an open-pit mine expands downwards, it also has to expand horizontally —you’re essentially excavating a pyramid shape into the earth. When the pit walls are nearing underground cavities from older mines —or if their expansion would result in such— this creates additional issues of wall stability that have to be worked around.

Apparently, this caused delays in mining operations at Candelaria which ultimately resulted in certain shipments of gold not being delivered/sold in time to be recorded in FNV’s Q3 as well as inducing the operator to turn to processing stockpiled ore in the meantime while the issue was being sorted —with stockpiled ore typically being of lower grades than ore that is typically immediately processed when extracted. This issue of delivery mismatch causing the superficial appearance of overall GEO-delivery weakness from the mine and FNV’s expectation of “a stronger quarter for GEOs delivered and sold from Candelaria for Q4” seems to be corroborated by the Candelaria operator, Lundin Mining’s, 2024Q3 call (which was on the same date as FNV’s) which described Q3 as “one of Candelaria’s strongest quarters on record.” (Though note that Lundin’s primary interest at the mine is copper, vs gold for FNV, and FNV mentions that “Lundin Mining has revised its 2024 gold production guidance for Candelaria at lower”). Overall, I take the Candelaria issue as temporary or overblown, while I chalk up the ramp-up delays at new mines as forgivable.
Thus —assuming no massive decline in gold prices— I’m inclined to think FNV should still be priced at around that $133/sh level, ex-Cobre. As I’m writing this, the stock has already recovered to around $120/sh.
.
I was recently re-reading some old copies of “The Micro Cap & OTC Stock Letter” by Marcus Frampton, CIO of the state-owned Alaska Permanent Fund, and thought Frampton POV on gold in a portfolio was interesting. (The site is no longer maintained, not sure what happened to it, but you can read some of the old posts here (if you click through the back-issues, it takes a few seconds to load the PDFs, but it does still work)). What Frampton mentions in these letters is his use of gold ETFs as a hedge on a dollar-for-dollar basis against his microcap positions, partial reason being that those microcaps were very often too illiquid to directly short or to hedge via options. Frampton also included gold as a way of diversifying correlations in his portfolio and hedging market volatility and inflation —providing opportunities to rebalance and “sell high and buy low” when one side of this uncorrelated barbell rose as the other fell depending on market conditions.
Like I mention in my initial Franco Nevada post, the company’s fundamentals are rather uncorrelated from the rest of the market.


(Note that I ignore the 2007-2008 change in CFFO for FNV from their IPO in the chart)
Given the current Cobre setup for FNV…
with the CEO mentioning that “[i]f and when it comes back at its full operating rate, that would be roughly a 30% increase in our GEOs and revenues” per the 2024Q3 earnings call, around the same upside I valued the Cobre re-opening at in my initial FNV post
the recent Q3 weakness that I see as largely temporary
plus the fact that the business is basically just ownership of a big vault of gold, distributed underground and around the world,
… I plan to use it as my “gold ETF” portfolio diversifier in a similar fashion as Frampton.
Like I mentioned earlier, gold hedges a portfolio in situations where inflation can’t be solved by rate hikes (or where governments do not want to use rate hikes due to already-weak economic growth). That is, I see cash as a growthflation hedge and gold as a stagflation hedge —and both cash and gold as a valid deflation hedge when governments cut rates. Meanwhile, around 16-17% of FNV’s revenues are also generated from royalties on energy assets which benefit in growthflation and Goldilocks environments and slightly hedge FNV’s gold portfolio in these scenarios where it tends to do less well. Furthermore, gold is also commonly thought of as a hedge against political volatility and the Trump Presidency is more likely than not going to be a volatile one (https://www.reuters.com/markets/us/wall-street-girds-trump-20-tariffs-tax-cuts-volatility-2024-11-06/).
My current PT for FNV is $152/sh with the expectation that Cobre is re-opened in 2025.

*One problem I have with gold investments as a portfolio hedge is that gold itself, while having a rather Lindy global acceptance through human history as a store-of-value asset, is not a productive asset —aliens might find FNV not too different than a purveyor of Beanbag Babies. To this end, I think that a business like OTC Markets might be a better investment (which also benefits from inflation as well as market volatility, remaining profitable through 2007-2009 as well as through every quarter of the 2020 global shutdown and the 2022 inflation shock). However, I think that it has it’s own problems and most importantly, unlike FNV, I think is fairly valued at the moment.
In any case, unless this decade is finally the one out of the hundreds of years of prior human history where everyone finally decides that gold is not a legitimate store of value (in which case I hope Bitcoin is agreed upon as a replacement rather than a as a similar liability), then I think FNV will at least be a you-don’t-lose-too-much investment.
.
Maybe it would be even better to use an equal-weighted version to further mitigate survivorship bias of a cap-weighted index as well as compare performance against the opportunity cost of some default portfolio of existing capital allocators that I’d have realistically been comfortable setting-and-forgetting my money with (eg. a mix of Berkshire, Markel, FRMO Corp. / RENN Fund, money market funds, et al).
This is what my quick analysis actually showed for GEO’s historical relationship with the market…
Here compared against my “market” proxies: Berkshire, Johnson & Johnson, and Proctor & Gamble over a 20-year period:

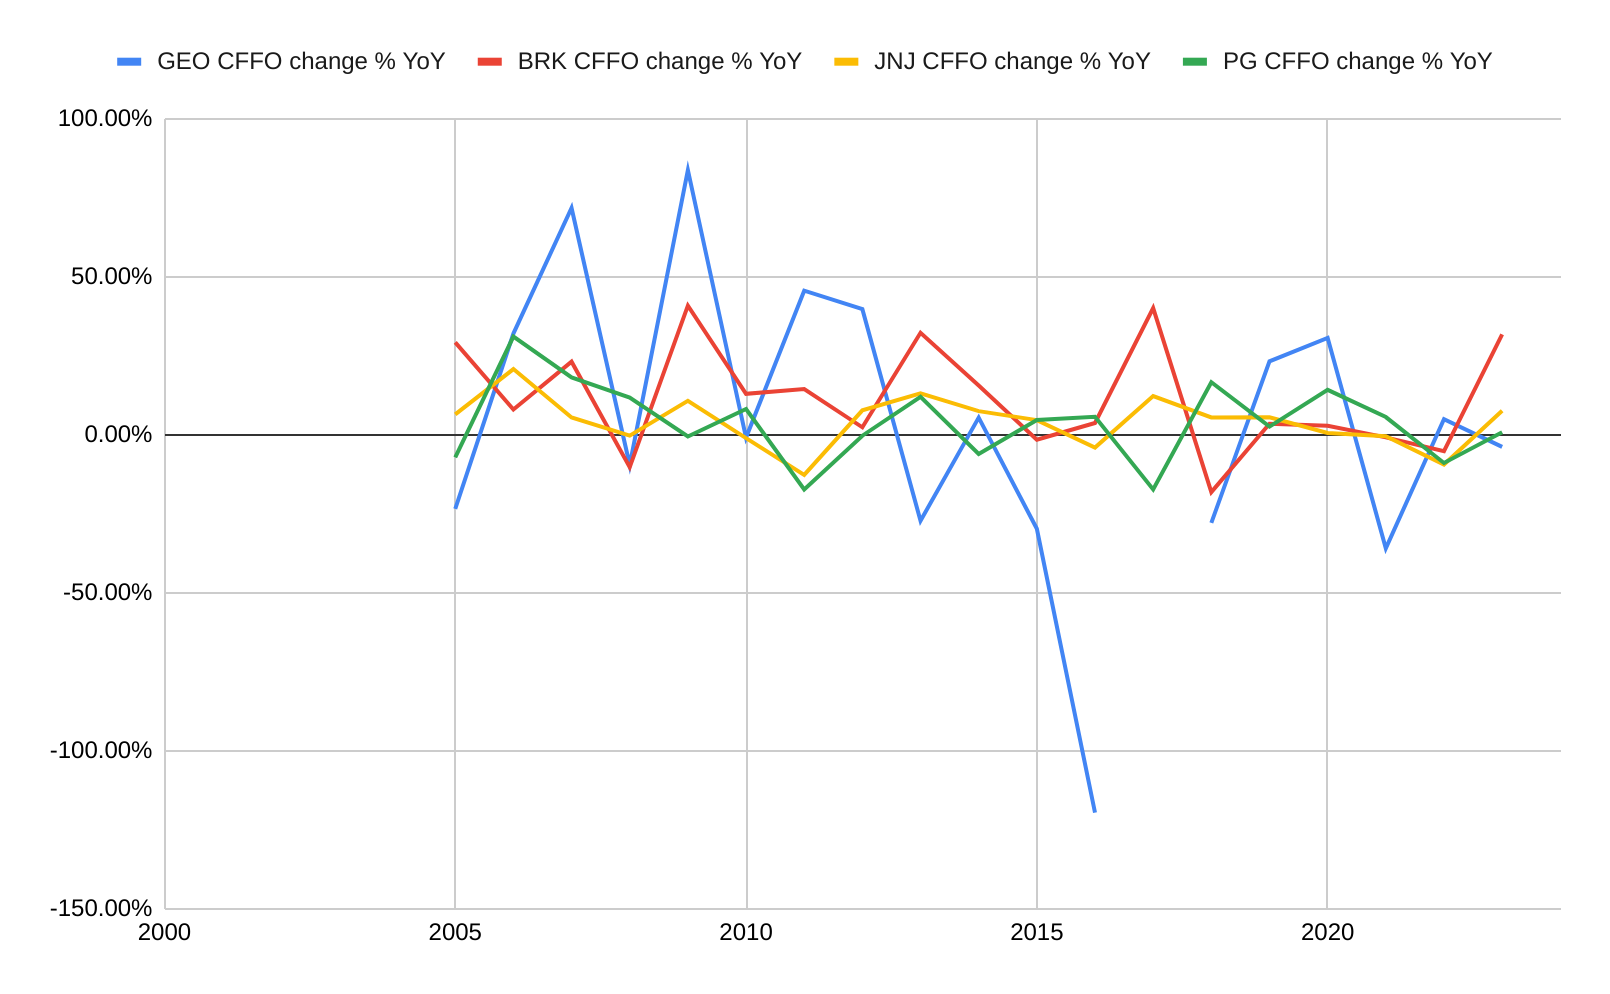
We can also look at a linear regression of quarterly price changes in GEO, BRK, JNJ, and PG vs the S&P 500 (SPY) from start of 2011 to 12/26/2024 to get a sense of GEO’s coupling to the market vs these larger proxies. Here we make a scatter plot with SPY quarterly price changes in the X axis and the target stock’s price changes in the Y axis (note that these are plotted totally independent of the time the occurred):


The R-squared values mean that if R^2=X for a linear regression line, then (100*X)% of the variability in the Y-axis variable is explain by the line derived from the X-axis (ie. the quarterly price changes in the S&P 500). In this case, we can see that virtually 0% of change in GEO stock are generally explained by price level changes in the wider market, whereas BRK and JNJ stock changes are explained to a much greater degree by the wider market (IDK what to make of PG). This these R-squared relationships hold even when I try to “over-fit” the curves to the data by adding higher degrees of polynomials to the linear models. This is not exhaustive (eg. chopping up data across time or, say, defined market “eras” or leaving out subsets, etc.), but it passes my “yeah, ok, good enough” threshold for believing that GEO is indeed non-correlated with the rest of the market.

Of course, the resource quality and quantity underlying a piece of land can vary from acre to acre as well as the logistical convenience of extracting resources from —or developing other infrastructure through— any given acre, but I’m pretty sure TPL and LB are similar in this respect as well.
The prospectus is also interesting as it includes maps that highlight the attractiveness of LB’s Delaware basin acreage in terms of relative total recoverable oil reserves on their lands as well as the relative amounts of produced water as a byproduct of oil well operations on those lands that then must be transported, treated, and disposed of or recycled —with LB collecting right-of-way, easement, and royalty fees throughout this process. The maps also help to give one a sense of LB’s ownership ratio of and proximity, or planned pipeline connections, to the overlapping areas of the more oil-rich —and high water producing (produced water-to-oil ratio, WOR)— land within the Delaware basin. LB highlights that “as of April 25, 2024, within the Delaware Basin, approximately 52% of active drilling rigs, 50% of active drilling permits and 52% of drilled but uncompleted wells (“DUCs”) were located within 10 miles of our land position.” Keep in mind that even if there is no pipeline connecting water resources on LB land to a particular area, operators there can still buy brackish water from —for well drilling and fracking completions— and dispose of produced water into —as a byproduct of fracking as well as naturally occuring within formations that must then be separated from extracted O&G— LB property via tanker trucks to transport the water.

See the prospectus sections regarding “Overview of our Land Position” as well as “Northern Delaware Basin Pore Space for Water Handling” for these maps (https://www.sec.gov/Archives/edgar/data/1995807/000119312524172433/0001193125-24-172433-index.htm), noting that lower pore space pressure in a given area means greater injection capacity for produced water and that there often many regulations around maximum allowed pressures to prevent fractures of geological formations and subsequent contamination beyond intended disposal/injection zones (https://www.epa.gov/sites/default/files/documents/21_McCurdy_-_UIC_Disposal_508.pdf; https://www.gwpc.org/wp-content/uploads/2023/01/Pore_Space_Occ___FINAL.pdf).

********** UPDATE 20250130: My current guess —and it is a total guess— is that the facilities in the Stateline AMI are probably a 50/50 mix of brackish sourcing and produced water disposal. My thinking on this simply comes from the fact that the AMI agreement between TPL and WaterBridge give WB exclusive rights to market produced water in the AMI, but the prospectus also mentions sourcing water into New Mexico and the LB acreage within the AMI is directly above a particularly thick area of the Pecos Valley aquifer (which can be seen directly south of the intersection of the Eddy, Lea, and Loving county border intersection in surveys). (In combination with their positioning along the New Mexico boarder to most directly facilitate the regulatory arbitrage on the more development-friendly Texas side in the shortest distance, I think this (sizable) positioning above and around some of the thickest parts of the Pecos aquifer makes LB’s acreage particularly attractive vs other surface rights owners in the Delaware basin).
(https://www.twdb.texas.gov/publications/reports/numbered_reports/doc/R382_PecosValley.pdf; this has some other interesting maps as well)
Meanwhile, the planned facilities in central Stateline position (between Loving and Winkler) are likely more for produced water recycling/disposal in Loving and brackish sourcing in Winkler (only because those dots in Winkler are atop a particularly water-rich region of the Capitan Reef minor aquifer within the major Pecos aquifer). From the pore pressure map in their prospectus, we can assume that the planned facilities in north Winkler and Andrews are going to be much more geared towards recycling/disposal facilities. **********
See LB’s 2024Q3 earnings call for more on this discussion.
From LB’s 2024Q3 10Q… “Surface use royalties increased by $12.4 million, or 144%, to $21.0 million for the nine months ended September 30, 2024, as compared to $8.6 million for the nine months ended September 30, 2023.” Furthermore, “[e]asements and other surface-related revenues increased by $4.3 million, or 187%, to $6.6 million for the three months ended September 30, 2024, as compared to $2.3 million for the three months ended September 30, 2023. The increase was primarily attributable to oil and gas transportation and gathering pipelines and produced water handling infrastructure of $3.4 million”. That is, 79% of that same-period YoY easement revenue increase was due to WaterBridge infrastructure build-out (I assume largely due to the Devon Energy partnership). This is a major uplift to revenues and I wonder how sustainable this kind of growth will be going forward.
********** UPDATE 20250108: I thought this article was very apropos. **********
Note that the apparent matching of curves in this image by shifting and/or scaling axes does not *necessarily* indicate that, for example, inverse real rates could be used to create a well-fitting linear regression curve against gold prices; IDK where I’d get the data to do this at the moment. Also note that this latter chart does not imply that gold and rates are at risk to snap back or revert, as the chart is showing historical correlation of *movements* rather than, say, historical parity of *values* —unless a linear regression model did indeed show that inverse real rates significantly predicted gold prices, then maybe you could make a mean-reversion case about the recent divergence if it could be explained by factors that were mostly temporary (though it would be based on the hypothetical regression line, not the line in this chart).
Really, I’d need to see the base rates of net gold buying by CBs to make a comment on this
Very interesting and informative thoughts. I really appreciate your look under the hood at FRMO, WELX, RCG. I have a bit of trouble understanding your WUBA concepts, but that is probably just me.